dxrpy with references against mailnews, plus bespin wishes

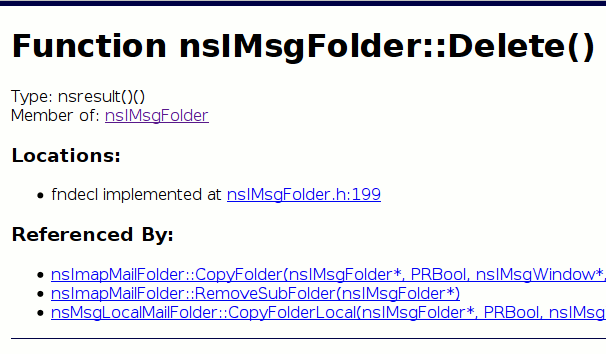
dxrpy-nsimsgfolder-delete

bsmedberg‘s dxrpy likes to generate documentation using dehydra (bsmedberg’s blog posts on this: 1 2).  I have added support for references/referencedBy extraction and otherwise wailed on it a little bit, and run this against JUST comm-central’s mailnews/ directory.  The collection process is still strictly serial, and there’s a lot of stuff in mozilla-central/comm-central, which is why the subset.  You can find the outputs here.  My repository with my changes is here.  There are all kinds of issues and limitations, of course.

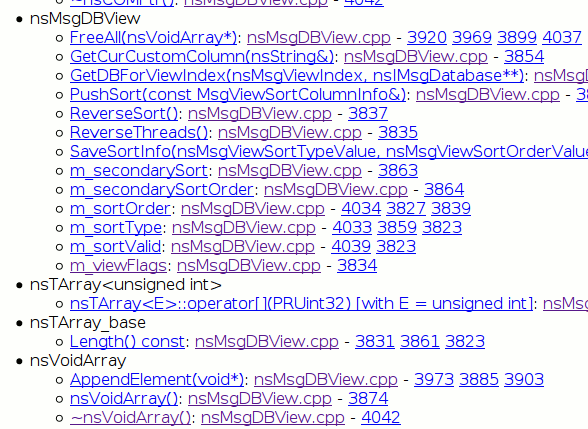
The picture above is of nsIMsgFolder::Delete(), the major advantage over mxr being that we’re not going to have ambiguity from completely unrelated Delete methods.  Note that in the mxr link I am cheating by not filtering to mailnews/, but the point is that with dxrpy you don’t need to do that.  The picture below shows a slice of the ‘references’ information for nsMsgDBView::Sort.  Another thing you could see is who is using nsVoidArray (in mailnews/!) by virtue of referencing its destructor.

dxrpy-nsmsgdbview-sort-references

My interest in this is a continuation of my efforts on pecobro to provide an interface to expose performance information from various means of instrumentation.  That such a thing requires a useful interface substrate is just a nice surprise.  The dehydra C++ stuff complements the references/referenced by work I did for javascript in pecobro.  Eventually I would hope to use the jshydra infrastructure to accomplish the js stuff since the parser pecobro uses is an unholy/brittle thing, and a usable jshydra would have all kinds of other exciting uses.

Things I would be very happy for other people to magically do so I don’t need to do them:

  • Magic up bespin so that it can pull files out of hg.mozilla.org.  One of the significant reasons I did not do more work on pecobro is that the approach of syntax highlighting in DOM explodes quite badly when confronted with source files you might find in mozilla-central/comm-central.
  • Make dxrpy generate json files representing the information it knows about each source file (positions => semantic info) as well as each function (positions in a function of references=> semantic info on those references).
  • Make bespin retrieve those json files when the file is loaded so that its naive syntax highlighting can be augmented to correlate with that semantic info.  One could attempt to be clever and use simple regexes or something to allow this information to be maintained while you edit the file, but I only need bespin to be read-only.
  • Make it easy for bespin to use that info to follow references and return without sucking.
  • Make something that extracts stack-traces from socorro and clusters this information by class, sticking it in static json files too, why not.
  • Make bespin use its semantic and just general line number info to grab the stack-trace crash info so that it can highlight code in bespin that is suspected to be crashy.  (You would probably want to get clever about determining what is a potentially innocent frame in the trace and what should be considered actually crasy.  Knowing when you’re calling out of your module is probably a simple and useful heuristic.)
  • Make something that chews the crash stacks with the dehydra/dxrpy data to make a visualization of where the crasy stuff is happening, module-wise.)
  • Make bespin retrieve json files of file/class-oriented json files that my performance tooling generates, letting me display cool sparkline/sparkbar things in the source.
  • Cleanup/infrastructurization of dxrpy’s generation/display mechanisms.  My greatest need of dxrpy is actually a coherent framework that can easily integrate with bespin.  The tricky part for my performance work is the javascript side of the equation, and the pecobro tooling actually does pretty well there.  It just wants to have a migration path and an interface that doesn’t cause firefox to lock up every time I change syntax-highlighted documents…

And if anyone already has a tool that is basically a statistical profiler that can do stack-traces that fully understand the interleaved nature of the C++ and spidermonkey JS stacks, that would be great.  (Bonus points for working with the JIT enabled!)  My dream would be a timer-driven VProbe based solution; then I could run things against a replay and avoid distortion of the timescale while also allowing for a realistic user experience in generating the trace.  I would like to avoid having to do trace reconstruction as I have done most recently with dtrace and chronicle-recorder.  I would not be opposed to a PythonGDB solution, especially if VMware 6.5 still provides a gdb remote thinger (did the eclipse UI make that disappear?), although that would probably still be more crossings than I would like and perhaps slower (if less distorting) than an in-process or ptrace based solution.

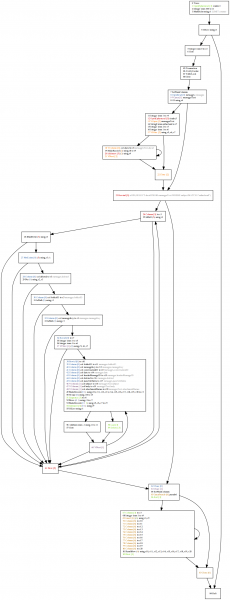
visualization of control-flow/data-flow analysis of sqlite EXPLAIN-ations

control-flow before

control-flow before

While doing some work on the gloda-based search targeted for beta 2, I came upon some query slowness and decided to look into it.  Because gloda queries are (conceptually, at least) dynamic, we also generate dynamic SQL.  Our schema is fairly normalized, and it’s not always obvious to me what I can expect to have going on.  EXPLAIN QUERY PLAN is a good litmus test for massive insanity, but it’s a bit concise.  For example, the troublesome SQL was as follows:

SELECT * FROM messages INNER JOIN messagesText ON messages.id = messagesText.rowid WHERE id IN (SELECT docid FROM messagesText WHERE subject MATCH "sutherland") AND deleted = 0 AND folderID IS NOT NULL AND messageKey IS NOT NULL ORDER BY date DESC LIMIT 100;

This nets us:

0|0|TABLE messages WITH INDEX deleted
1|1|TABLE messagesText VIRTUAL TABLE INDEX 1:
0|0|TABLE messagesText VIRTUAL TABLE INDEX 2:

Everything’s an index!  We win!  Sorta.  The index it chose is somewhat worrying if you think about it.  But really, it’s all quite nebulous.  I have basically no idea what is happening in there.  The good news is that EXPLAIN will tell us the actual opcodes in use.  The bad news is that it is quite hard to understand (104 opcodes), at least for this query.

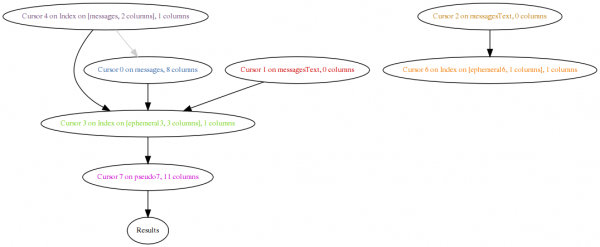
Python, graphviz, pygraphviz, and compulsive tool-building to the rescue!  My original plan was that data-flow analysis could make everything incredibly obvious as to what is going on.  I’m not sure I reached that point.  But in the process, the efforts required to make the system clever enough to do data analysis allow the control flow diagram to be quite pretty and have lots of useful information.  The main sign of data-flow analysis is that all cursor write operations have the list of cursors that data flowed from in parens.  Each cursor gets its own tango-ish color, and opcodes involving the cursor are colored by that cursor.

The major flaw in the data-flow analysis that springs to mind right now is that it ignores control flow.  An action that will only be taken because of a control-flow decision based on data retrieved from a cursor should ideally establish a relationship.  This is important because gloda throws around a lot of set intersections (although not in this case) in its queries, and it would be nice to be able to concisely express that.  The control-flow diagram is arguably orders of magnitude better than a raw EXPLAIN, but my hope is/was that the data analysis can make it trivial to figure out how things are being hooked up.  Given the amount of effort already expended and the present results, I figure I’m probably at the “control flow is good enough for the foreseeable future stage of things”.

In any event, the control-flow graph makes it (more) obvious that the outer loop is using the ‘deleted’ index to walk over *every deleted message in the database*.  A one-off idiom computes the full-text search and stashes it in an intermediary table.  As we then walk over every deleted message, we see if that message can be found in the full-text search result table.  If it is, our previously queued lazy-seek against the main messages table happens and we search against the full-text table to do our join.  And out pop results!

My hope for this query was that the deleted condition would be executed as a constraint as we were walking our result set, just like the folderID and messageKey constraints.  Making sure your queries are using the right index and helping the optimizer make the right call is a fairly textbook problem and the SQLite docs are actually pretty good on this.  For the sake of the example, I have dropped the index entirely.  (The ‘deleted’ index was added so we can quickly mark messages as needing deletion processing without slowing down deletes for the user.  It may turn out to be more beneficial to leave the field as-is, but use a separate table as our work queue.)

dataflow before

dataflow before

control-flow after

control-flow after

After the deletion, we get the revised diagram.  The full-text search still happens completely before we produce any other results, but this is keeping in keeping with our query.  (The query generation code is designed to handle the case where we have multiple constraints and must intersect the results of each.  It can clearly be optimized for the case where no primary-key intersection is required.)  The traversal of the full-text search result set is now the outer loop.  Deleted is now just filtering like folderID and messageKey, as expected.

The major lingering red flag is the block that calls Last() and Delete().  The conditional that makes the decision to do that is using “r1”, which is apparently implementing our limit logic inside the code.  This was confusing until I remembered that we’ve got an ORDER BY going on.  The Delete is just culling the results that will never potentially be seen.  The bad news is that we are doing our full-text search join prior to the ORDER BY culling.  So, my original fear that we are doing the JOIN no matter what still holds.  And that’s enough excitement for one day.

Given that any full-text search with ordered results will require retrieval the entire result set and correlating it against at least one table, I’m tempted to create separate tables for different windows of time given the importance of recency.  Thoughts/input appreciated, as anyone who has read this far is probably very detail oriented…

UPDATE (Feb 25, 2009): The hg repo is http://hg.mozilla.org/users/bugmail_asutherland.org/grokexplain/.  It now does some actual value propagation (and has had various bugs fixed).  By default it ignores ‘Yield’ because the way in which they are used (basically generator/continuation) wreaks havoc on the CFG with just straightforward static analysis.  If you want the yields, pass “yields” on the command line.  Also, passing “debug” gets you the states of the registers at the entrance/exit of the “basic blocks”.  (Not technically basic blocks, but close enough for my purposes.)