understanding where layout goes wrong with gecko reflow debug logs (Part 1)

HTML and CSS provide awesome layout potential, but harnessing that potential to do your bidding can sometimes be problematic.  I suspect all people who have written HTML documents have been in a situation where they have randomly permuted the document structure and CSS of something that should work in the hopes of evolving it into something that actually does work.  Matching wits with a black box that is invulnerable to even pirate-grade profanity is generally not a pleasant experience.

It turns out gecko has a way to let you see inside that black box.  Well, actually, multiple ways.  There’s a layout debugger (that seems broken on trunk?) that can display visual overlays for box sizes/events/reflow counts, dump info about paints/invalidations/events as they happen as well as dumping the current content tree and frames.  Even better, gecko’s frame reflow debugging mechanism will dump most of the inputs and outputs of each stage of reflow calculations as they happen.  With some comparatively minor patches[1] we can augment this information so that we can isolate reflow decisions to their origin presentation shell/associated URL and so that we know the tag name, element id, and class information on HTML nodes subjected to reflow calculations.  A reasonably sane person would want to do this if they were planning to be doing a lot of potentially complicated HTML layout work and would a) benefit from better understanding how layout actually works, b) not want to propagate layout cargo culting or its ilk from the code being replaced, c) not want to waste days of their lives later the next time this happens, d) help locate and fix layout bugs if bugs they be so that all might benefit.

Of course, with logs that effectively amount to execution traces, examining them by hand is frequently intractable unless you really know what you’re looking for or are dealing with a toy example.  My non-reduced problem case resulted in 58,107 lines, for one.  So writing a tool is a good idea, and writing it in JS using Jetpack doubly so.

In any event, the problem is I am trying to use the flexible box model to create an area of the screen that takes up as much space as possible.  In this space I want to be able to house a virtual scrolling widget so I use “overflow: hidden”.  Regrettably, when my logic goes to populate the div, the box ends up resizing itself and now the whole page wants to scroll.  Very sad.  (Things work out okay with an explicitly sized box which is why my unit tests for the virtual scrolling widget pass…)

Let’s formulate a query on the div of interest (which I will conceal) and then see what the first little bit of output is:

*** Box 24 tag:div id: classes:default-bugzilla-ui-bug-page-runBox
*** scroll 25 tag:div id: classes:default-bugzilla-ui-bug-page-runs
scroll 25 variant 1  (parent 24) first line 406
  why: GetPrefSize
  inputs: boxAvail: 0,UC
          boxLast: 0,0
          reflowAvailable: 0,UC
          reflowComputed: 0,UC
          reflowExtra: dirty v-resize
  output: prefWidth: 0
          minWidth: 0
          reflowDims: 0,0
          prefSize: 0,0
          minSize: 0,0
          maxSize: UC,UC
  parent concluded: minSize: 0,0
                    maxSize: UC,UC
                    prefSize: 2,0
scroll 25 variant 2  (parent 24) first line 406
  why: Layout
  inputs: boxAvail: 771,1684
          boxLast: 0,0
          reflowAvailable: 771,UC
          reflowComputed: 771,1684
          reflowExtra: dirty dirty-children h-resize v-resize
  output: prefSize: 0,0
          minSize: 0,0
          maxSize: UC,UC
          reflowDims: 771,1684
          layout: 2,0,771,1684
  parent concluded: minSize: 0,0
                    maxSize: UC,UC
                    prefSize: 0,0
                    layout: 0,0,773,1684

This is the general pattern we will see to the reflows.  The parent will ask it what size it wants to be and it will usually  respond with “ridiculously wide but not so tall”.  (Not in this first base case, but the next one responds with a prefsize of “1960,449”, and that’s pixels.) The parent will then perform layout and say “no, you need to be taller than you want to be”, at least until I start cramming stuff in there.

So we skim down the output to find out where things first went off the rails…

scroll 25 variant 16  (parent 24) first line 20548
  why: GetPrefSize
  inputs: boxAvail: 1960,UC
          boxLast: 771,1686
          reflowAvailable: 1960,UC
          reflowComputed: 1960,UC
          reflowExtra: dirty-children h-resize v-resize
  output: prefWidth: 1960
          minWidth: 352
          reflowDims: 1960,1755
          prefSize: 1960,1755
          minSize: 352,1755
          maxSize: UC,UC
  parent concluded: minSize: 0,0
                    maxSize: UC,UC
                    prefSize: 1962,1755
scroll 25 variant 17  (parent 24) first line 20548
  why: Layout
  inputs: boxAvail: 771,1755
          boxLast: 1960,1755
          reflowAvailable: 771,UC
          reflowComputed: 771,1755
          reflowExtra: dirty-children h-resize
  output: prefSize: 0,0
          minSize: 352,1755
          maxSize: UC,UC
          reflowDims: 771,1755
          layout: 2,0,771,1755
  parent concluded: minSize: 0,0
                    maxSize: UC,UC
                    prefSize: 0,0
                    layout: 0,0,773,1755

Okay, that looks pretty likely to be the area of concern.  The parent asked it for its ideal size, so it told it, but then the parent apparently decided to enlarge itself too.  That is not what we wanted.  We would have been cool if just the scroll #25 enlarged itself (or its block child #26 that corresponds to the same content node but which I have elided because it always says the same thing as its parent #25) since some frame needs to end up holding the overflow coordinate space.

Thus concludes part 1 of our exciting saga.  In part 2, we hopefully figure out what the problem is and how to fix it.  Lest anyone suggest the root problem is that I am completely off base and am not remotely reasonably sane for choosing this as a strategy to solve the problem… it works in chrome.  Which is not to say that my html/css is correct and firefox’s layout is wrong; it’s quite possible for layout engines to err or deal with unspecified behaviour cases in my favor, after all.  But it does make me want to understand what the layout engine is thinking and be able to do so with a minimum of effort in the future, since I doubt this is the last time I will not immediately understand the problem or that layout engines will differ in their behaviour.

For those who want to play along at home: the raw gzip’d /tmp/framedebug file (gunzip to /tmp/framedebug) that is the entirety of the trunk firefox log with debug output, the spliced output just for the one window derived from an invocation of “cfx run splice” (it will show up under the URL in /tmp/framedumps), and the output of the output of “cfx run summarize serial-12-0 summarize unique 22,24,25,26.  Those unique identifiers are deterministic but arbitrary values for the given file.  We discovered them by using the query on the CSS class using “cfx run summarize serial-12-0 summarize class wlib-wlib-virt-wlib-virt-container-root”.  The hg repo for the processing tool is here, the mozilla-central patches are: first and second.  A minor jetpack patch is also required for the command line stuff to work.

1: I was initially trying to avoid patching anything.  This didn’t work out, but it did cause the initial log file splicing logic to leverage the arena allocation scheme of presentation shells to allow us to to map frames back to their URLs.  Sadly, it turned out the arena allocation blocks requested from the upstream allocators are really small (4k or 1k) and all from the same source and so I had to instrument the allocation as well as adding debug output of the window/docshell/presshell linkages.  The output adds an unacceptable additional level of noise to the default DEBUG case; the right thing to do is likely to cause the reflow log debugging to emit the document URL before each logging outburst if it is different from the last outburst.

Thunderbird Quick Filter Bar extensions, they’re a thing!

The previously discussed Quick Filter Bar interface landed in time for Thunderbird (Lanikai) 3.1 beta 2 (whose release is real-soon-now).  Although the Quick Filter Bar already contains dangerously high levels of awesome, we made sure to make it extensible so you can cram even more awesome in.

As an example, I have created an extension that enables you to ‘pivot’ based on the currently selected message(s).

In its most straightforward manner of operation, you can click on an e-mail address in the message reader header and pivot by that e-mail address.  Out of the box, this will show you all the messages in the current folder sent by that user.  You can also (or only) show messages where that user is on the to/cc lines by toggling the buttons on the expando bar appropriately.

You can also constrain the display to only show messages within some time interval of the message(s) in question.

The more confusing way to access the pivot functionality is to simply toggle the facet on the quick filter bar.  When you toggle the filter on, we walk all of the selected messages and build up a list of the observed e-mail addresses for all of the senders and all of the recipients.  One trick is that we filter out any e-mail addresses associated with your own account in order to avoid the filter becoming too inclusive.  We save those e-mail addresses into our state.  We also walk all the messages and find the time range that the messages cover and save that.  These are used as the basis for the specific constraints you can enable from the expando bar.  Because the values are saved, the filter does not change when you change your selected messages.  You need to toggle the pivot filter off and on again (or use the ‘pivot’ option on the email address popup) to change the data we are pivoting on.

The extension can be found on AMO and in source form.  In a forward-looking move that is probably complicating things for now, I used the Jetpack SDK and its XUL extension support to implement the extension.  In practice, all the example uses Jetpack for is its CommonJS module system and the standard mozilla-style JS modules would have been sufficient.  All the UI stuff is done purely in XUL overlays bound to the backing code using addEventListener.

The broad strokes for implementing a Quick Filter Bar extension are:

  1. Overlay your toolbarbutton into the quick filter bar, preferably the #quick-filter-bar-collapsible-buttons box.  If you have an expando bar you want to contribute, you probably want to put that into the #quick-filter-bar-expando.  As things currently stand, multiple expando bars being uncollapsed at the same time will probably turn out poorly, so you may need to be pragmatic and put your bar outside that box or do something clever.
  2. Import resource:///modules/quickFilterManager.js, implement your filter, and register it with QuickFilterManager.defineFilter() (whose documentation explains the interface you need to conform to).

We will likely not be doing up full documentation for this extension point beyond the in-code documentation and in-tree/extension examples.  This is an advanced extension point by virtue of it touching nsIMsgDBHdrs, nsIMsgDBViews, nsIMsgSearchSessions, and friends, all of which have sharp edges.  The way forward with soft, human-friendly documented abstractions is gloda and that’s where (my) effort will be concentrated.  The awesome in this extension point is making it practical for people who already have the scars to utilize the full power of the message view/traditional search subsystem without losing a limb and do so in a previously impossibly short period of time.

PS: I made the icon!

work-in-progress tooling: feeding GWT SpeedTracer systemtapped mozilla performance data

Now that Thunderbird 3.1 is string/feature-frozen it’s time to focus on performance.  This post is just to make sure that people who are also working on similar things know what I’m up to.  For example, there’s some very exciting work going on involving adding a startup timeline to mozilla-central that everyone keeping up-to-date with mozilla performance work should be aware of.  In summary, no results yet, but soon!

The big bullet points for now are:

  • GWT SpeedTracer is a very impressive tool.
  • I have seriously cleaned up / automated my previous SystemTap script work for mozilla.  Invoking python chewchewwoowoo.py speedtracer/mozspeedtrace.stp `pgrep thunderbird-bin` does the following:
    • generates a version of the source script with any line statements fixed up based on one or more line seeks in a file.
    • builds the command line and invokes the system tap script.
    • invokes a post-processing script specified in the tap file, feeding it address-translation helpers and systemtap bulk logging per-cpu fusion.
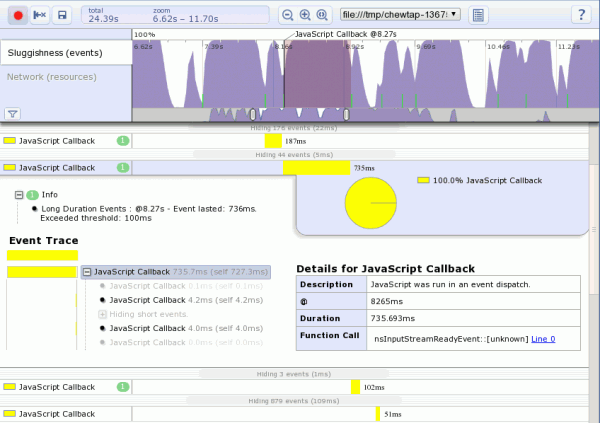
  • mozspeedtrace.stp and its post-processor produce an HTML file with embedded JSON that the SpeedTracer Chrome extension recognizes as one of its own.  (SpeedTracer runs in Firefox through the GWT development mode, but being very new to GWT I am not yet clear on if/how to be able to wrap it up to be used as a webapp from static data.)
  • My mapping of events as recorded by my SystemTap probes to SpeedTracer events is somewhat sketchy, but part of that is due to the limited set of events and their preconfigured display output.  (I believe it turns out I can generate optional data like fake stack traces to be able to expand the set of mapped events without having to modify SpeedTracer.)  This is way basically everything in the screenshot is a yellow ‘JavaScript Callback’.
  • I have not implemented probes for all of the event types defined by SpeedTracer, I have not ported all of my previous probes yet, and there are still some new probes yet to add.  Happily, most of the hard work is already in the can.
  • The motivation behind this is very different from the startup timeline.  Thunderbird uses mozilla-1.9.2, not mozilla-central, and my primary investigatory focus is memory usage in steady-state after start-up, not the time it takes to start up.  (We do, of course, want to improve performance where possible.)  It just so happens that in order to usefully explain who is allocating memory we also have to know who is active at the time / why they are active, and that provides us with the performance timeline data.
  • This work is not likely to be useful for per-tab/webpage performance data gathering… just whole-program performance investigation like Thunderbird needs.
  • This is a work-in-progress, but the focus is on improving Thunderbird’s performance issues, not building tooling.  As such, I may have to bail on SpeedTracer in favor of command-line heuristic analysis if I can’t readily modify SpeedTracer to suit my needs.  I picked SpeedTracer partially to (briefly) investigate GWT, but from my exploration of the code thus far, the activation energy required may be too great.

a systemtap script to attribute JS string memory costs to the creating JS functions

----- js_GC data pages: 96731 total vm pages: 234849
   ###      KiB
 11376      839 BF_format                                        log4moz.j:487
 15906      725 mime_emitter_writeBody                           jsmimeemitter.j:381
   148      576 MimeMessage_coerceBodyToPlaintext                mimemsg.j:341
  4460      492 gloda_ds_queryFromQuery                          datastore.j:2988
  9655      387 <MYSTERIOUS>                                     <BEYOND THE VEIL>:0
   911      237 gloda_content_quoted                             connotent.j:267
  1723      144 gloda_indexMessage                               index_msg.j:2597
   187      141 gloda_content_content                            connotent.j:290
   170      108 gloda_content_getContent                         connotent.j:166
  1917       73 gloda_identity_toString                          datamodel.j:785
  1775       69 Log4Moz_enumerateProps                           log4moz.j:220
value |-------------------------------------------------- count
    0 |@                                                    366
    1 |@@@@                                                1371
    2 |@@@@@                                               1584
    4 |@@@@@@@@@@@@@@@@@@@@@@@@                            6863
    8 |@@@@@@@@@@@@@@@@@@@@@@@@@@@@@@@@@@@@@@@@@          11784
   16 |@@@@@@@@@@@@@@@@@@@@@@@@@@@@@@@@@@@@@@@@@@@@@      12794
   32 |@@@@@@@@@@@@@@@@@@@@@@@@@@@@@@@@@@@@@@@@@@@@@@@@@  14016
   64 |@@@@@@@@@@@@@@@@@@@@@@@@@@@@@@                      8662
  128 |@@@@@@@@@@@@@@                                      4093
  256 |@@@@@                                               1567
  512 |@                                                    309
 1024 |                                                     105
 2048 |                                                      58
 4096 |                                                      28
 8192 |                                                      17
16384 |                                                      12
32768 |                                                       0
65536 |                                                       0

The script.  It tells you what JS code has been creating strings since the last GC and the overall distribution of the marginal costs of those strings, leaving out puny code that allocates less than 64k’s worth.  Marginal costs because spidermonkey has support for dependent strings.  “a += b” will actually result in the storage of a being realloc’d with a pointing into the storage of a’.  I forgot to check for the js_ConcatStrings case at first and, let me tell you, the stats were not pretty.  Poor mime_emitter_writeBody was accused of allocating 11 gigabytes of strings in one intra-GC cycle!

What is interesting about this script is that it is actually pulling all of the function name/script name/line number information directly out of a JSContext object.  What is exciting is that it was pretty easy to do thanks to systemtap’s understanding of DWARF debug symbols.  This is in severe comparison to my efforts using VProbes where there was no such support and I had to write a gdbpython script to begin to approach the same thing.  Also, because systemtap’s guru mode allows you to bail into real C code when you need, I was able to write a function that truncates the jschar (16-bit unicode) strings that make up the function names into ASCII that is both straightforward and efficient.  It also allowed for a quick/easy/fast basename() implementation too.

It is worth noting that spidermonkey does have built-in (conditionally compiled) static probe points originally created for DTrace and that they do provide more generic object lifetime hooks.  Although they were created for DTrace, systemtap is also able to use them.  The limitations with those probes is that once any probe is active using a hook, a non-trivial cost is incurred because filtering can only be performed inside the probe and you may receive orders of magnitude more calls than you actually care about.  The cost is worst for probes that provide function names since that requires a call to js_GetStringBytes every time (although there is some caching.)  Keep in mind that I’m not saying the systemtap userspace probes are free, but since they can be placed at arbitrary points, you can have probes that fire only in the cases you actually care about, only incur data-processing costs when desired, and are disturbingly easy to implement since you can just reach into the data structures you care about.

Since everyone loves an implementation fight, DTrace, great and magical though it is, is basically incapable of pulling off the JS stack-walking trick that systemtap makes possible.  Unless DTrace has grown these features since I last checked, it lacks the DWARF magic to do such things easily and the language intentionally avoids the control-flow constructs that would allow it to do anything quite so complex.  And you can entirely forget about arbitrary C code for the unicode string truncation…

This post is brought to you by efforts to decrease the memory footprint of Thunderbird when gloda’s indexer is active.  Because Thunderbird loves you.  But it loves your memory more.  For now.  That’s what we’re trying to fix.

performance annotated SQLite EXPLAINation visualizations using systemtap

For the Thunderbird 3.1 release cycle we are not just fixing UX problems but also resolving various performance issues.  Building on my previous work on a visualization of SQLite opcode control flow graphs using graphviz I give you… the same thing!  But updated to more recent versions of SQLite and integrating performance information retrieved through the use of systemtap with utrace.

In this case we are using systemtap to extract the number of times each opcode is executed and the number of btree pages that are requested during the course of executing the opcode.  (We do not differentiate between cache hits and misses because we are looking at big-O right now.)  Because virtual tables (like those used by FTS3) result in nested SQLite queries and we do not care about analyzing the queries used by FTS3, we ignore nested calls and attribute all btree page accesses to the top-level opcode under execution.

Because the utility of a tool is just as dependent on ease of use as its feature set, I’ve cleaned things up and made it much easier to get information out of Thunderbird/gloda with this patch which should land soon and provides the following:

  • The gloda datastore will write a JSON file with the EXPLAINed results of all its SQL queries to the path found in the preference mailnews.database.global.datastore.explainToPath.  This preference is observed so that setting it during runtime will cause it to create the file and begin explaining all subequently created queries.  Clearing/changing the preference closes out the current file and potentially opens a new one.
  • Gloda unit tests will automatically set the preference to the value of the environment variable GLODA_DATASTORE_EXPLAIN_TO_PATH if set.
  • A schema dump is no longer required for meta-data because we just assume that you are using a SQLite DEBUG build that tells us everything we want to know about in the ‘comment’ column.
  • grokexplain.py now uses optparse and has more internal documentation and such.

So what do the pretty pictures show?

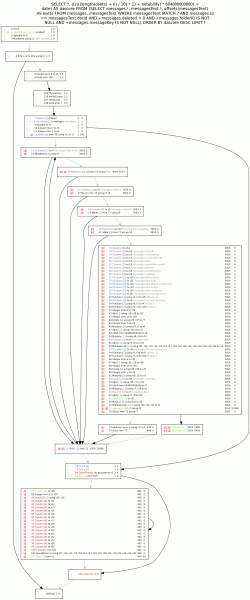
  • Before: A gloda fulltext query search retrieves all of the results data before applying the LIMIT.  This results in a lot more data transplanted into temporary results tables than we will end up using; wasted bookkeeping.  Additionally, we incur the row lookup costs for both our messages data storage table and our fulltext messagesText table for all hits, even the ones we will not return.  (Noting that there was no escaping hitting both tables since we were using offsets() and it hits the fulltext table as part of its operation.)
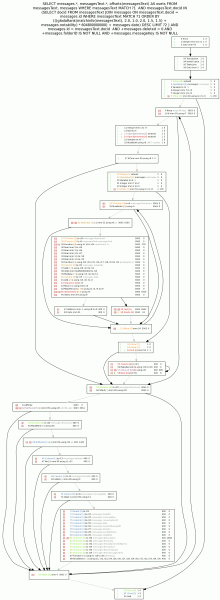
  • After: We perform an initial query phase where we minimize wasted bookkeeping by only retrieving and using the bare minimum required to compute the LIMITed list of document id’s.  Additionally, by use of the FTS3 matchinfo() function instead of the offsets() function we are able to avoid performing row lookup on the messagesText table for results that will not be returned to the user.  Use of the matchinfo() function requires a custom ranking function which allows us to be somewhat more clever about boosting results based on fulltext matches too.
  • The poor man’s bar graphs in the pictures are expressing a hand-rolled logarithmic scale for the number of invocations (left bar) and number of btree pages accessed (right bar).  On the right side of each line the actual numbers are also presented in the same order.  The goal is not to convey good/bad so much as to draw the eye to hot spots.

Notes for people who want more to read:

  • SQLite has built-in infrastructure to track the number of times an opcode is executed as well as the wall-clock time used; you do not have to use systemtap.  It’s a conditional compilation kind of thing, just -DVDBE_PROFILE and every statement you execute gets its performance data appended to vdbe_profile.out when you reset the statement.  It doesn’t do the btree pages consulted trick, but it’s obviously within its power with some code changes.
  • Our use of systemtap is primarily a question of discretionary reporting control, the ability to integrate the analysis across other abstraction layers, and various build concerns.  The JSON output is not a driving concern, just something nice we are able to do for ourselves since we are formatting the output.
  • The tool has really crossed over into the super-win-payoff category with this fix investigation.  (Having said that, I probably could have skipped some of the data-flow stuff last time around.  But these projects are both for personal interest and amusement as well as practical benefit, so what are you gonna do?  Also, that effort could pay off a bit more by propagating comments along register uses so that the LIMIT counter register r8 and the compute-once r7 in the after diagram would not require human thought.)

References:

  • The grokexplain repo.  Used like so: python grokexplain.py –vdbe-stats=/tmp/glodaNewSearchPerf.json /tmp/glodaNewSearchExplained.json -o /tmp/glodasearch-newcheck
  • The systemtap script in its repo.  Used like so: sudo stap -DMAXSTRINGLEN=1024 sqlite-perf.stp /path/to/thunderbird-objdir/mozilla/dist/lib/libsqlite3.so > /tmp/glodaNewSearchPerf.json
  • The bug with the gloda explain logic patch and the improved SQL query logic.  I also used the tooling to fix another (now-fixed) bug, but that problem turned out to be less interesting.

who is starring Firefox tinderbox failures and how long before they do?

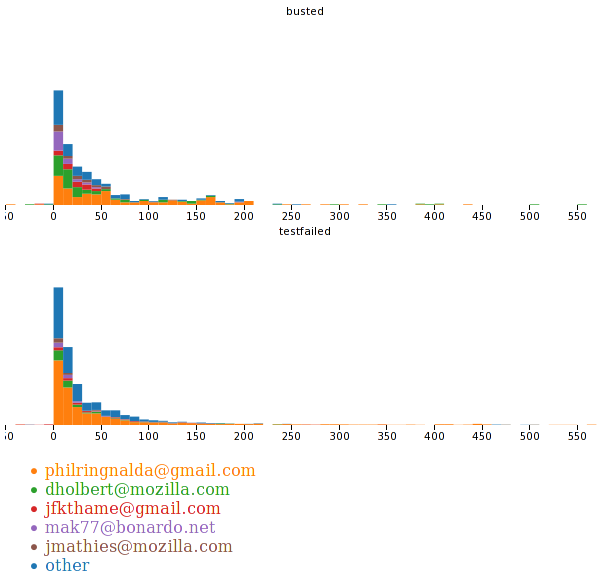
Using the accumulated data in my CouchDB instance about the Firefox tinderbox and Protovis, we can see how long it takes before a testfailed/busted build gets starred and who stars it.  The horizontal axis is the number of minutes between the end of the build and when it gets starred.  If someone stars the build before it finishes running, a negative number is possible.  The vertical axis is a double-height histogram, which is to say the scaling is percentage based and don’t try to infer absolute numbers.  Colors tell us who did the starring.

The winner is philor.  I knew that going in, I just wanted to see it.  Thank you for reducing the pain of dealing with the tree!

more systemtap mozilla event loop awareness

====================                                             ms    #
----- Event Loop:
  nsInputStreamReadyEvent                                      7119   11
----- Input Events:
  nsInputStreamPump                                            7119   11
----- Pump Events:
  thunk:nsNNTPProtocol::QueryInterface(...)                    7119   11

====================                                             ms    #
----- Event Loop:
  nsInputStreamReadyEvent                                      6284   15
  nsTimerEvent                                                  242  123
----- Timers:
  nsUITimerCallback                                             121    2
----- Input Events:
  nsInputStreamPump                                            6284   15
----- Pump Events:
  thunk:nsNNTPProtocol::QueryInterface(...)                    6283   15

As of late, I’ve noticed that Thunderbird has been pegging one of my CPU cores periodically in ways not correlated with gloda activity, the usual scapegoat.  With some enhancements to my systemtap script from last time, I can now see that it apparently takes something like 13 seconds of dominating the event loop to perform the check for new messages in my 26 subscribed news folders on news.mozilla.org.  Yowch.  At least this is on a debug build!

Changes are that we now cover input stream ready events, input pump listeners, and proxied objects (which lets us see what Thunderbird IMAP gets up to).  Also, the output is more concise and only shows things that take at least 100ms of aggregate wall clock time.

Script invocation currently wants to look like this:
sudo stap -v moz-event-loop.stp /path/to/thunderbird/objdir/mozilla/dist/lib/libxpcom_core.so /path/to/thunderbird/objdir/mozilla/dist/bin/components/libnecko.so | ../addrsymfilt.py `pgrep thunderbird-bin`

Thunderbird ĝLȬdÅ full text search tokenizer now supports accent folding, non-ASCII case-folding, and more!

Thanks to the efforts of Makoto Kato (jp-blog en-blog twitter) whom you may remember as the bringer of CJK bi-gram tokenization, I have just pushed tokenizer support for case-folding, accent-folding, and voiced sound mark magic to comm-central.  The net result is that searches for “ĝLȬdÅ” will now find “gloda” and vice versa.  Less crazy searches should also be improved.

Starting tomorrow, Thunderbird (in the guise of Lanikai) 3.1 nightlies will have this capability and it will also show up in the next beta (beta 2).  No action on your part is required; when you start running a build with this capability your existing gloda database will get blown away and indexing will start from scratch.  If you go back to an older version for some reason after having used the updated build, the old build will also decide to blow away your database, so try to avoid making a habit of switching between them.

We also have some significant performance enhancements related to gloda search and indexing slated for beta 2, not to mention* usability enhancements to avoid the dreaded gloda search/quick search toggle dance.

* This expression is weird given that I go on to mention the allegedly unmentioned, but it still makes more sense than “all but X”.

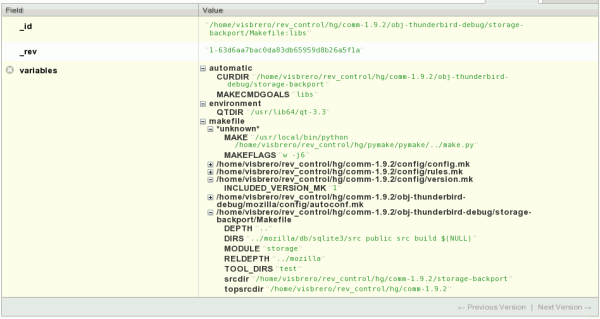
partial: posting pymake data/results to a couch

What it does:

  • Adds a “–couch-json” option to bsmedberg‘s pymake that takes a URL that crams the state of (global, non-rule associated) variables into a couch document for each makefile context executed.  Variables are grouped by general origin as well as specific Makefile origin where relevant.  The code as it stands only tells you about make variables that were accessed because this cuts down on things you (I) don’t care about.  (For example, if FOO and BAR are defined but only FOO is ever expanded, then only FOO goes in the couch document.)

I think there’s a fair bit of potential in this (pushing “make -p” style data/make output into couch), at least in situations where there’s no escaping make, you don’t already have usable/appropriate tooling, and python/CouchDB/JSON is one of your religions.

I’m hoping to avoid touching the mozilla build system in any meaningful fashion from here on out, so I am unlikely to work on this much more, but it could be useful to others, hence this post.  The repo is here, check out the “understand” (p)branch.  (The changes are not suitable for upstreaming as things stand.)

emacs compilation-mode support for reviewboard

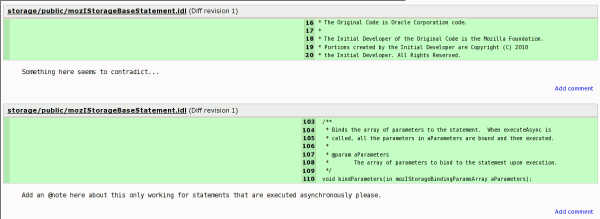
Let’s say you’ve suckered someone into performing their review in my review board install (more info).  It looks pretty, no?  As the Amish say: ‘Tis a fine web page, but sure ’tis no emacs buffer, English.

Get your reviewboard-viewer.el here (repo here).  It basically just wgets the review with paths in a format the GNU regex will recognize and tells the temporary file to be a compilation-mode buffer with a little help in setting up the file search path.  There are instructions in the file, but the key non-intuitive things that are going to trip you up:

  • You really want to invoke reviewboard-viewer-view-review from a dired buffer showing the root directory of what the patch is against.  This lets us set up the search path to be exactly correct with no heuristics.
  • The argument the above wants is the id that you will see in the “bugzilla-style export” link on the review page.  For example, I had to type the number 72 above.

Other notes to people who are interested/care:

  • There was a dumb bug in the bugzilla export code involving caching.  Previous bugzilla exports likely only showed the selected hunk for the first comment on the file.  I fixed this.
  • OpenID snafus:
    • Weave OpenID support via the Accout Manager doesn’t work.  (Account Manager is where it got refactored to after it got dropped from Weave core).  I feel like it worked recently with 0.0.2, but just now when I tried (with 0.0.2) it pretended it was going to work and then failed to do so.  When I upgraded to 0.0.10 it decided to not even do that.  This is sad because Weave was the whole reason I went with OpenID; I wanted to make it easier than creating another throwaway account for people.
    • I hear that whatever Google OpenID-ish thing exists, it apparently does not work either.  This was not surprising since it was my understanding Google made their implementation correct but not interoperable without some extra work.
    • Verisign’s freebie OpenID thing does work!
    • If someone knows of a django auth-compatible OpenID/OAuth/whatever implementation that will at least fix the Google situation and requires practically no work on my part, I would be happy to change to using that.  Right now I am using django-openid-auth which is old but works.  My reviewboard repo is here if you are feeling especially generous about fixing things.