Tinderbox results in bugzilla, jetpack times 2, CouchDB, review board

mstange‘s Tinderboxpushlog is awesome.  You know it, I know it, the many people whose sanity has been saved by it know it.  It is a fantastic improvement on checking the tinderbox; it lets you know the current state of the tree, the recent history of the tree, and how these things are correlated with recent commits.  What it is not good at (nor intended for) is to be a historical record.  Tinderboxpushlog ‘scrapes’ the tinderbox on-demand using tinderbox time windows and does not have the ability to key off anything but the time.

So if one refactored the scraper into a CommonJS module suitable for use with the newly rebooted jetpack, hooked it up to a cron job, and crammed its outputinto a CouchDB database, what would you get?

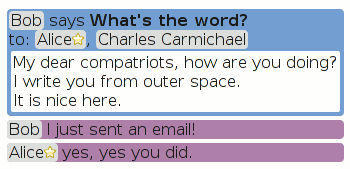
Exactly, something you can hook up to johnath and ehsan‘s magic bugzilla jetpack (last mentioned on the blog here).  You can install it from here.  (johnath/ehsan, please feel free to pull the changes into the upstream repo; I’m still wary of randomly pushing things into other people’s user repos…).  I know the presentation is ugly, not the least because the text labels are inconsistent with tinderboxpushlog; feel free to push into my user repo with improvements.  Oh, and for this to work you need to put an honest-to-goodness URL in your bugzilla comment or attachment description; there is no all-powerful regex if you type things out by hand.

You can find the thing that pushes thing into the couch using refactored tinderboxpushlog logic here.  Some cuddlefish runner tweaks (not all of which are likely advisable) can be found in my user jetpack-sdk repo.  (The new jetpack reboot is wicked awesome, by the way.)

Right now the cron job is running against the MozillaTry, Firefox, and Thunderbird3.1 trees on the tinderbox every 5 minutes.  While it should be pretty easy for me to keep the cron job and couch server online, I make no guarantees about the schema used in the couch, just that I will keep the jetpack in sync with it.  And if the service starts exceeding the resources of my (personal) linode, I may have to tweak polling rates or what not (‘what not’ meaning ‘up to and including turning it off’).

There is other work happening in this area and I am excited about that.  For example, I think brasstacks has an encompassing vision that should help provide historical data about which tests failed, etc.  With any luck, my efforts here will be mooted by buildbot and magic awesome dust.

The mention of reviewboard in the title is just that if you are using my review board stuff and put a link to your try server commit in the attachment description, we will use that to pull the official hg changeset as the basis for the diff.  The main benefit of this is that if your patch depends on other patches in your queue that are not yet in the trunk, the diff will still work out.  Specifically, if your queue had A, B, and C applied (where C is the tip) and you link to C, then we will provide a diff of C relative to B.  Please be aware that hg.mozilla.org is rather slow about providing the hg changeset diffs on demand so this will be at least an order of magnitude slower than the fetch of an already-available patch from bugzilla.  Repo with changes is here.

Thunderbird Message Filter Bar Prototype Extension, check it.

What was just the quick-search box in Thunderbird 2 is now also the home to global search in Thunderbird 3.  This hasn’t turned out splendidly, although we didn’t expect that it would.  Some people think quick-search is gone because they do not realize you can change the modes of the search box.  Other people are hardcore and know how to switch between the modes, they just don’t like all the clicking.

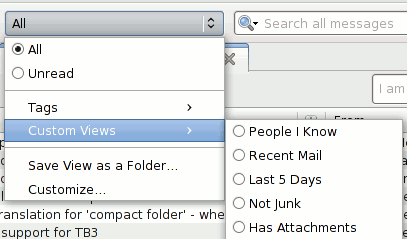
So we’re thinking about splitting the quick-search out into its own separate box.  In addition, we’re trying to expose a lot of the power of the “mail views” system.  You may know “mail views” as that boxy thing that lived with the quick-search box above the thread pane in Thunderbird 1.5 but then became something you had to customize onto the toolbar at some point.  It looks like this:

Thunderbird has a very nice search subsystem under the hood that powers quick-search, “advanced search”, virtual folders, etc.  Mail views was and is the mechanism that allowed you to define arbitrary searches and use them as filters on any folder.  Unfortunately it’s not a smooth operator and its defaults have some issues.  There’s no “starred” filter unless you define your own, there’s no “any tag” filter unless you define your own, and “People I Know” only checks one of the two address books you are likely to have in your profile.  Even with those defined, you’re looking at 3 clicks to get to most things.

So the message filter bar is also trying to bring one-click access to these things you might care about.  In the top screenshot, that’s what you’re looking at.  Starred messages, messages from people in any of your local address books, messages with tags, and messages with attachments are all at your fingertips.  The new quick-search location over on the right works right with them.  And if you love mail views and all the clicking-finger muscle strength it helps build, it works with mail views too!

One bit of polish that I’m hoping people like and performs sufficiently well is the tags case.  When you haven’t clicked on the tags icon, the bar in the screenshot does not show that bit with the tags.  When you click on it, it 1) filters the visible messages to messages with tags, and 2) figures out what tags are on those messages and populates that bar with those tags.  You can then click on any of the tags to stop including messages with that tag (and none of the other tags still selected).

In any event, if you are interested, the prototype is being developed as an extension that you can find here on AMO (sandboxed) if you like pre-built XPIs and here in hg if you like source code.  It is very prototype-y at the current moment.  Keybindings aren’t there, localization/accessibility is not there, being able to make the filter bar go away isn’t there, etc.  We will iterate on things and productize assuming the concept works out.  Just be aware that I don’t believe sandboxed plugins auto-update, so you if you’re really interested you might need to keep an eye on the AMO page or the repo.

UPDATE: I have nuked the add-on from AMO since Thunderbird 3.1 beta 2 is now available.

Review Board and Bugzilla reviews, take 3

I’ve updated my review board setup once more (part 2, part 1).  The low barrier to entry is now even lower.  “How low?”, you might ask.  “On the ground!”, I might say.  “What other low low price features with big big value are on offer? With more facts and less spiel?”, you might then also ask…

  • It now works with patches that have a header.  Patches that were the result of an mq import and then directly uploaded will tend to have headers.  This was why sometimes patches would fail to import with unlikely errors about empty patches.
  • There is now a magic URL scheme that automatically pulls the patch, creates a review and bounces you to the review.  If the review already exists, it just directly bounces you.  That URL scheme is http://reviews.visophyte.org/r/bzpatch/bug###/attach###/.  There are no authentication requirements on using this URL nor viewing the diff or associated reviews.  However, if you want to actually use the review mechanism to make comments then you will need to login via OpenID.  See part 2 for more on that.
  • I modified johnath and Ehsan Akhgari’s magic bugzilla jetpack so that it also adds a “Review” link to patches.  My modified repo is here.  You can install it from here.  You can see what the word “Review” looks like up in the first screenshot.
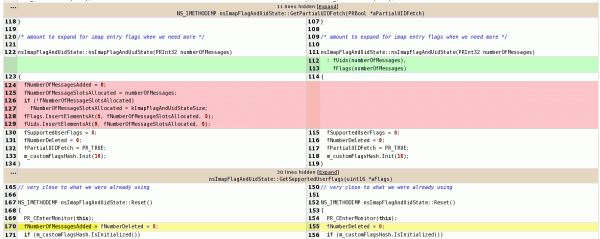
  • I upgraded to the reviewboard git trunk.  This adds some improvements to the diff display such as showing you function context information, even if the patch did not include it.  (And even if it did, too.  A lot of patches involving C++ truncate the function signature, whereas as you can see in the screenshot, you get the full text!)  I believe it is also supposed to be clever about recognizing moved blocks.

Limitations and other notes:

  • Patch fetching is synchronous and can take a while because we also parse it all up before we return.  Do not sit there hitting reload.  We’ll give you an error message if it doesn’t work out.  Not a great one, but an error message nonetheless.
  • Patches are still assumed to be against mozilla-central or comm-central (depending on the bugzilla product) trunk as of the moment we fetch the patch.  This means bit-rotted patches that you are only looking at now may fail to apply.  At the same time, patches where you clicked on the link back when it was timely and go back to look at them now that they are going out of style are still going to be applied against the same revision they were in the first place.
  • The repo with my modified changes (on the bzreview-master branch) was nuked and re-created because of the svn -> git transition by the reviewboard people.  So if you previously pulled, you should probably blow your old repo away rather than end up with a weird hybrid mixture.  (btw, hg-git works very nicely, with the caveat that its bookmark-based representation of the git branching idiom confuses pbranch really quite badly.)
  • Ping me on IRC or drop me an e-mail if you are experiencing reliable problems after having determined that the patch in question is not just full of gibberish.

Using systemtap to figure what your mozilla app’s event loop is up to

====================                                             ms    #
----- Event Loop:
  nsTimerEvent                                                 1233   31
  nsProxyObjectCallInfo                                          19   44
  nsStreamCopierOB                                                1   48
  nsStreamCopierIB                                                0   18
  nsProxyCallCompletedEvent                                       0   44
  nsProxyReleaseEvent                                             0   27
  nsTransportStatusEvent                                          0   19
  nsSocketEvent                                                   0   18
  nsHttpConnectionMgr::nsConnEvent                                0    1
----- Timers:
  OnBiffTimer(...)                                             1129    3
  nsGlobalWindow::TimerCallback(...)                             70   10
  nsAutoSyncManager::TimerCallback(...)                          29    6
  nsExpirationTracker::TimerCallback(...)                         1    1
  nsIdleService::IdleTimerCallback(...)                           0    5
  nsExpirationTracker::TimerCallback(...)                         0    1
  nsHttpHandler                                                   0    1
  nsUITimerCallback                                               0    2
  imgContainer::sDiscardTimerCallback(...)                        0    1
  nsExpirationTracker::TimerCallback(...)                         0    1

That’s one of the periodic outputs (10 seconds currently) of this systemtap script filtered through this python script to translate addresses to useful symbol names in realtime.  It’s like top for mozilla.

Actual invocation looks like so:
sudo stap -v moz-event-loop.stp /path/to/thunderbird/objdir/mozilla/dist/lib/libxpcom_core.so | ../addrsymfilt.py `pgrep thunderbird-bin`

The giant caveat (and giant hooray for utrace and Fedora having kernels with the utrace patches built-in) is that the magic in here is done dynamically using utrace source line probes.  As such, the probes aren’t resilient in the face of changes to the underlying source files; the current line numbers are targeted at 1.9.2.  There are various in-tree and out-of-tree solutions possible.

Thunderbird Jetpack Teasers: Words per Minute in Compose

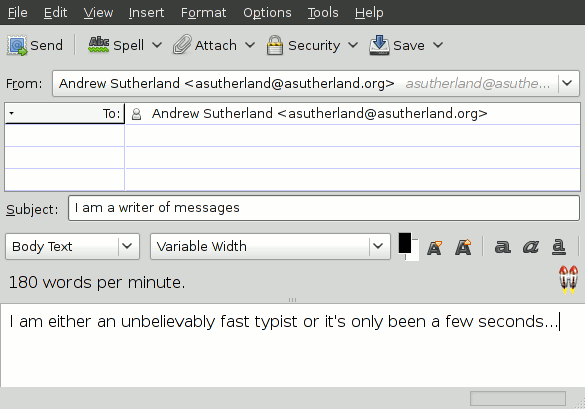
jetpack.future.import("thunderbird.compose");
jetpack.thunderbird.compose.appendComposePanel({
  onReady: function (panel, composeContext) {
    let doc = panel.contentDocument;
    let msgNode = $("<span />", doc.body).appendTo(doc.body);
 
    let started = Date.now();
    setInterval(function() {
      let words = composeContext.getPlaintextContents().split(/\s+/);
      let secs = Math.ceil((Date.now() - started) / 1000);
      let wordsPerMinute = Math.floor((words.length * 60) / secs);
      msgNode.text(wordsPerMinute + " words per minute.");
    }, 1000);
 
    panel.show();
  },
  html: <><body style="overflow: hidden"></body></>
});

thunderbird-jetpack-words-per-minute-example

prototype unified JavaScript/C++ back-traces for Mozilla in (archer) gdb

fused-js-cpp-backtrace-2-upper-half

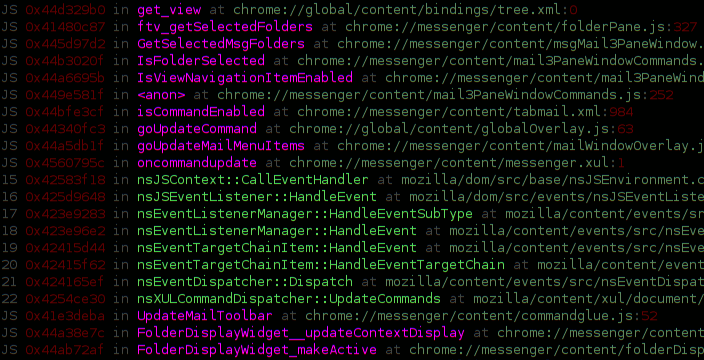
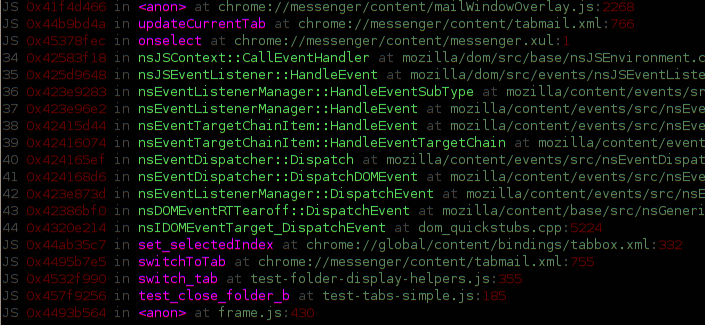
As far as I know (and ignoring my previous efforts on chroniquery along these lines), up until now you had your C/C++ Mozilla backtraces via gdb (chocolate) and your JS backtraces via “call DumpJSStack()” or the debugger keyword from within JS (peanut butter), but these two great flavors had never come together to make a lot of money for dentists.

The screenshots (which is actually just one screenshot split in two) show invocation of a custom python gdb command building on my previous exciting pretty gdb commands.  The command has filtered out boring JS interpreter / XPConnect code and interleaved exciting interesting JS stack frames.

The implementation is reasonably simple and intended to be able to be implemented using VProbes to support my recent performance work along those lines.  We walk stack frames the usual way.  Ahead of time, we have marked out the PC ranges of interesting JS interpreter functions (js_Interpret and js_Execute).  If the stack frame’s instruction pointer is in one of those functions we grab the JSContext argument.  We pop frames until we reach the native frame those functions allocate from their own stack space (whose boundaries we know from the stack walking).

There is one trick we have to do involving dormantFrameChain.  While js_Execute has a consistent and straightforward usage of JS_SaveFrameChain, XPConnect and its quickstub friends are more complex.  Right now we use a dumb heuristic that just looks if our frame pointer is 0 and there is a dormantFrameChain, and in that case we restore it.  (Thankfully the garbage collector needs to know about the shelved frames, otherwise we might have to chase frames down.)  I haven’t put much effort into thinking about it, but the heurstic seems a bit reckless.  We could likely just concurrently walk the XPConnect context stack to figure out when to restore dormant frame chains.  The existing VProbe JS stack (only) code already goes to the horrible effort to get at the thread-local stack, so it wouldn’t be too much more work.  Things probably also fall down during garbage collection right now.

Hg repository is here.  Under no circumstances try to use this with jblandy’s excellent archer-mozilla JS magic right now.  The current code is very distrustful of gdb.Value in a dumb way and does exceedingly dangerous things wherein pointers are bounced to strings and back to integers because direct integer coercion is forbidden.  With pretty printers installed this is likely to break.  Also, this is all only tested on 1.9.1.

fused-js-cpp-backtrace-2-lower-half

So’s your facet: Faceted global search for Mozilla Thunderbird

faceting-gloda-hover-davida-1

Following in the footsteps of the MIT SIMILE project’s Exhibit tool (originally authored by David Huynh) and Thunderbird Seek extension (again by David Huynh), we are hoping to land faceted global search for Thunderbird 3.0 (a la gloda) in beta 4.

I think it’s important to point out how ridiculously awesome the Seek extension is.  It is the only example of faceted browsing or search in an e-mail client that I am aware of.  (Note: I have to assume there are some research e-mail clients out there with faceting, but I haven’t seen them.)  Given the data model available to extensions in Thunderbird 2.0 and the idiosyncratic architecture of the UI code in 2.0, it’s not only a feature marvel but also a technical marvel.

Unfortunately, there was only so much Seek could do before it hit a wall given the limitations it had to work with.  Thunderbird 2.0’s per-folder indices are just that, per-folder.  They also require (fast) O(n) search on any attribute other than their unique key.  Although Seek populated an in-memory index for each folder, it was faced with having to implement its own global indexer and persistent database.

Gloda is now at a point where a global database should no longer be the limiting factor for extensions, or the core Thunderbird experience…

faceting-gloda-action-tag-hover-bienvenu-1

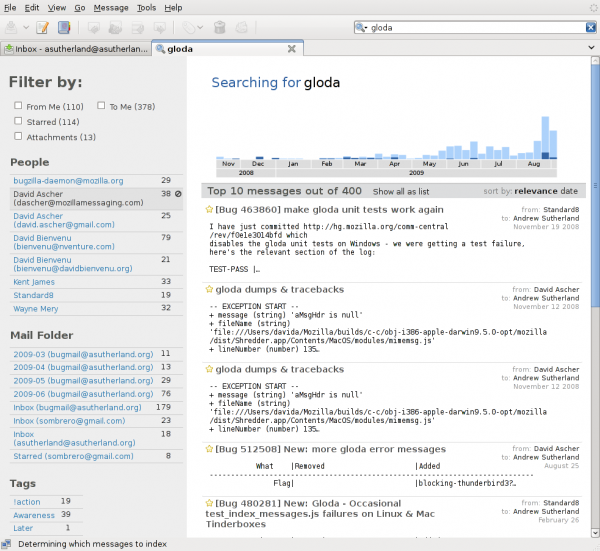
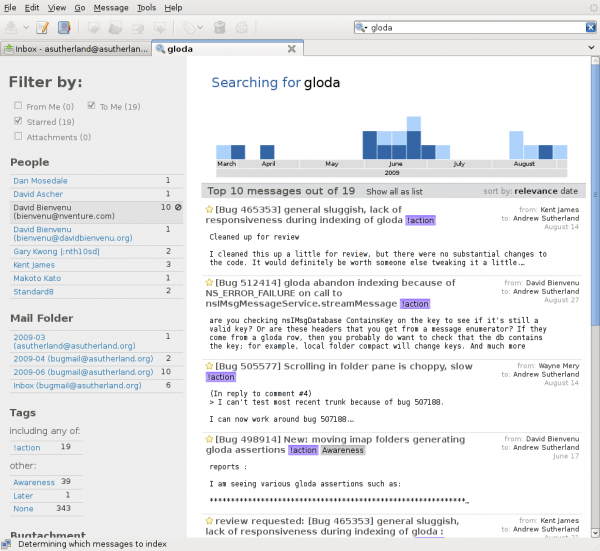
The screenshots are of a fulltext search for “gloda” in my message store.  The first screenshot is without any facets applied and me hovering over one of David Ascher’s e-mail address.  The second is after having selected the “!action” tag and hovering over one of David Bienvenu’s e-mail address.  Gloda has a concept of contact aggregation of identities but owing to a want of UI for this in the address-book right now, it doesn’t happen.  We do not yet coalesce (approximately) duplicate messages, which explains any apparent duplicates you see.

The current state of things is a result of development effort by myself and David Ascher with design input from Bryan Clark and Andreas Nilsson (with hopefully much more to come soon :).  Although we aren’t using much code from our previous exptoolbar efforts, a lot of the thinking is based on the work David, Bryan, and myself did on that.  Much thanks to Kent James, Siddharth Agarwal, and David Bienvenu for their recent and ongoing improvements to the gloda (and mailnews) back-end which help make this hopefully compelling UI feature actually usable through efficient and comprehensive indexing that does not make you want to throw your computer through a window.

If you use linux or OS X, I just linked you to try server builds.  The windows try server was sadly on fire and so couldn’t attend the build party.  The bug tracking the enhancement is bug 474711 and has repository info if you want to spin your own build.  New try server builds will also be noted there.  Please keep in mind that this is an in-progress development effort; it is not finished, there are bugs.  Accordingly, please direct any feedback/discussion to the dev-apps-thunderbird list / newsgroup rather than the bug.  Please beware that increases in awesomeness require that your gloda database be automatically blown away if you try the new version.  And first you have to turn gloda on if you have not already.

Using VMWare Record/Replay and VProbes for low time-distortion performance profiling

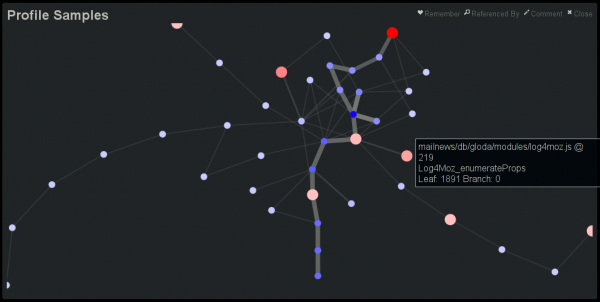
profile-performance-graph-enumerateProps

The greatest problem with performance profiling is getting as much information as possible while affecting the results as little as possible.  For my work on pecobro I used mozilla’s JavaScript DTrace probes.  Because the probes are limited to notifications of all function invocations/returns with no discretion and there is no support for JS backtraces, the impact on performance was heavy.  Although I have never seriously entertained using chronicle-recorder (via chroniquery) for performance investigations, it is a phenomenal tool and it would be fantastic if it were usable for this purpose.

VMware introduced with Workstation 6/6.5 the ability to efficiently record VM execution by recording the non-deterministic parts of VM execution.  When you hit the record button it takes a snapshot and then does its thing.  For a 2 minute execution trace where Thunderbird is started up and gloda starts indexing and adaptively targets for 80% cpu usage, I have a 1G memory snapshot (the amount of memory allocated to the VM), a 57M vmlog file, and a 28M vmsn file.  There is also and a 40M disk delta file (against the disk snapshot), but I presume that’s a side effect of the execution rather than a component of it.

The record/replay functionality is the key to being able to analyze performance while minimizing the distortion of the data-gathering mechanisms.  There are apparently a lot of other solutions in the pipeline, many of them open source.  VMware peeps apparently also created a record/replay-ish mechanism for valgrind, valgrind-rr, which roc has thought about leveraging for chronicle-recorder.  I have also heard of Xen solutions to the problem, but am not currently aware of any usable solutions today.  And of course, there are many precursors to VMware’s work, but this blog post is not a literature survey.

There are 3 ways to get data out of a VM under replay, only 2 of which are usable for my purposes.

  1. Use gdb/the gdb remote target protocol.  The VMware server opens up a port that you can attach to.  The server has some built-in support to understand linux processes if you spoon feed it some critical offsets.  Once you do that, “info threads” lists every process in the image as a thread which you can attach to.  If you do the dance right, gdb provides perfect back-traces and you can set breakpoints and generally do your thing.  You can even rewind execution if you want, but since that means restoring state at the last checkpoint and running execution forward until it reaches the right spot, it’s not cheap.  In contrast, chronicle-recorder can run (process) time backwards, albeit at a steep initial cost.
  2. Use VProbes.  Using a common analogy, dtrace is like a domesticated assassin black bear that comes from the factory understanding English and knowing how to get you a beer from the fridge as well as off your enemies.  VProbes, in contrast, is a grizzly bear that speaks no English.  Assuming you can convince it to go after your enemies, it will completely demolish them.  And you can probably teach it to get you a beer too, it just takes a lot more effort.
  3. Use VAssert.  Just like asserts only happen in debug builds, VAsserts only happen during replay (but not during recording).  Except for the requirement that you think ahead to VAssert-enable your code, it’s awesome because, like static dtrace probes, you can use your code that already understands your code rather than trying to wail on things from outside using gdb or the like.  This one was not an option because it is Windows only as of WS 6.5.  (And Windows was not an option because building mozilla in a VM is ever so slow, and, let’s face it, I’m a linux kind of guy.  At least until someone buys me a solid gold house and a rocket car.)

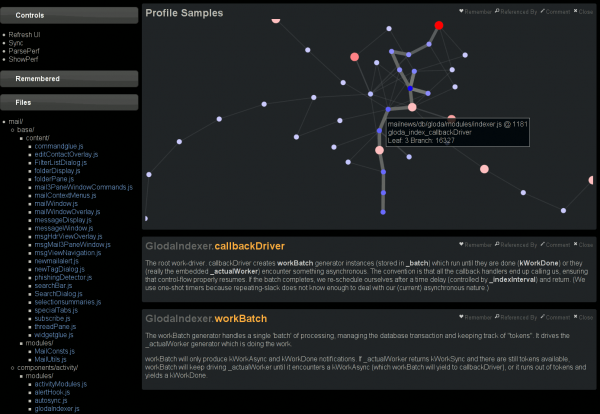
profile-performance-graph-callbackDriver-doubleClicked

My first step in this direction has been using a combination of #1 and #2 to get javascript backtraces using a timer-interval probe.  The probe roughly does the following:

  • Get a pointer to the current linux kernel task_struct:
    • Assume we are uniprocessor and retrieve the value of x86_hw_tss.sp0 from the TSS struct for the first processor.
    • Now that we know the per-task kernel stack pointer, we can find a pointer to the task_struct at the base of the page.
  • Check if the name of our task is “thunderbird-bin” and bail if it is not.
  • Pull the current timestamp from the linux kernel maintained xtime.  Ideally we could use VProbe’s getsystemtime function, but it doesn’t seem to work and/or is not well defined.  Our goal is to have a reliable indicator of what the real time is at this stage in the execution, because with a rapidly polling probe our execution will obviously be slower than realtime.  xtime is pretty good for this, but ticks at 10ms out of box (Ubuntu 9.04 i386 VM-targeted build), which is a rather limited granularity.  Presumably we can increase its tick rate, but not without some additional (though probably acceptable) time distortion.
  • Perform a JS stack dump:
    • Get XPConnect’s context for the thread.
      • Using information from gdb on where XPCPerThreadData::gTLSIndex is, load the tls slot.  (We could also just directly retrieve the tls slot from gdb.)
      • Get the NSPR thread private data for that TLS slot.
        • Using information from gdb on where pt_book is located, get the pthread_key for NSPR’s per-thread data.
        • Using the current task_struct from earlier, get the value of the GS segment register by looking into tls0_base and un-scrambling it from its hardware-specific configuration.
        • Use the pthread_key and GS to traverse the pthread structure and then the NSPR structure…
      • Find the last XPCJSContextInfo in the nsTArray in the XPCJSContextStack.
    • Pull the JSContext out, then get its JSStackFrame.
    • Recursively walk the frames (no iteration), manually/recursively (ugh) “converting” the 16-bit characters into 8-bit strings through violent truncation and dubious use of sprintf.

The obvious-ish limitation is that by relying on XPConnect’s understanding of the JS stack, we miss out on the most specific pure interpreter stack frames at any given time.  This is mitigated by the fact that XPConnect is like air to the Thunderbird code-base and that we still have the functions higher up the call stack.  This can also presumably be addressed by detecting when we are in the interpreter code and poking around.  It’s been a while since I’ve been in that part of SpiderMonkey’s guts… there may be complications with fast natives that could require clever stack work.

This blog post is getting rather long, so let’s just tie this off and say that I have extended doccelerator to be able to parse the trace files, spitting the output into its own CouchDB database.  Then doccelerator is able to expose that data via Kyle Scholz‘s JSViz in an interactive force-directed graph that is related back to the documentation data.  The second screenshot demonstrates that double-clicking on the (blue) node that is the source of the tooltip brings up our documentation on GlodaIndexer.callbackDriver.  doccelerator hg repovprobe emmett script in hg repo.

See a live demo here.  It will eat your cpu although it will eventually back off once it feels that layout has converged.  You should be able to drag nodes around.  You should also be able to double-click on nodes and have the documentation for that function be shown *if it is available*.  We have no mapping for native frames or XBL stuff at this time.  Depending on what other browsers do when they see JS 1.8 code, it may not work in non-Firefox browsers.  (If they ignore the 1.8 file, all should be well.)  I will ideally fix that soon by adding an explicit extension mechanism.

Thunderbird Jetpack messageDisplay.overrideMessageDisplay fun.

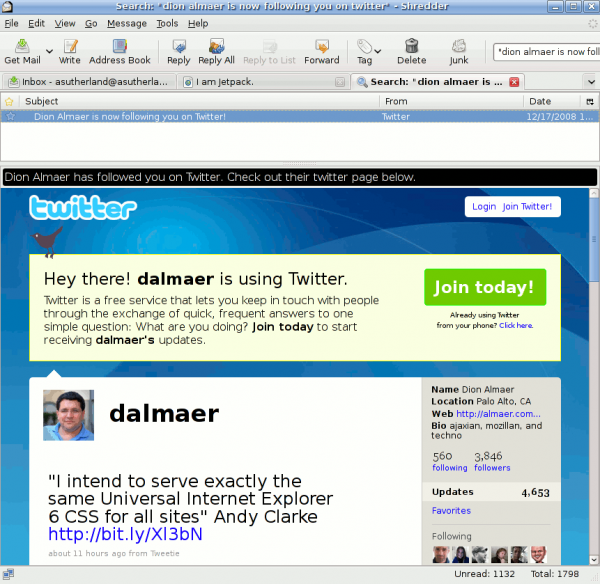
jetpack-twitter-follow-notification

As part of our goal to make it easy to write extensions for Thunderbird 3, we’ve been working on getting Jetpack running under Thunderbird and exposing Thunderbird-specific points. This is all experimental, but it’s having good results.

The first example replaces the message you get from twitter when someone follows you and instead shows you that person’s twitter page so you can see what they’ve written. Unfortunately, if you try and click on links on the page you will become sad because they all try and trigger your web browser. But Standard8 is hard at work resolving the content display issues. Besides demonstrating registration via a regex over the sender’s e-mail address, it also shows us extracting message headers from the message. Also, we introduce a small HTML snippet that precedes the nested web browser so it’s not just an embedded web browser.

jetpack.future.import("thunderbird.messageDisplay");
jetpack.thunderbird.messageDisplay.overrideMessageDisplay({
  match: {
    fromAddress: /twitter-follow-[^@]+@postmaster.twitter.com/
  },
  onDisplay: function(aGlodaMsg, aMimeMsg) {
    let desc = aMimeMsg.get("X-Twittersendername", "some anonymous jerk") +
      " has followed you on Twitter.  Check out their twitter page below.";
    return {
      beforeHtml:
        <>
          <div style="background-color: black; color: white; padding: 3px; margin: 3px; -moz-border-radius: 3px;">
            {desc}
          </div>
        </>
      url: "http://twitter.com/" + aMimeMsg.get("X-Twittersenderscreenname")
    };
  }
});

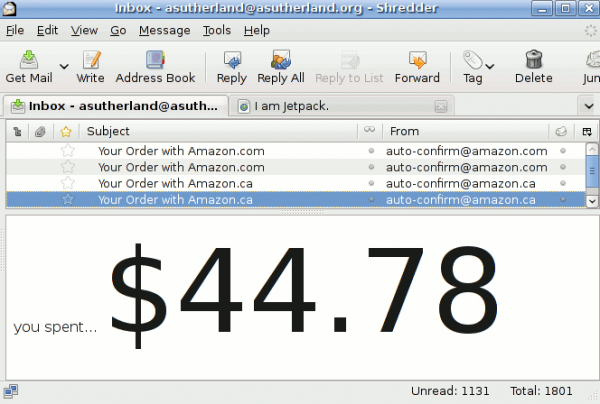
jetpack-amazon-big-total

Our second example of the extension point replaces e-mails from Amazon about an order (order confirmation and shipment confirmation) with the amount of money you spent on the order in BIG LETTERS (or rather BIG NUMBERS). It uses a regular expression run against the message body to find the total order cost. Then it generates a simple web page to present the information to you.

jetpack.future.import("thunderbird.messageDisplay");
jetpack.thunderbird.messageDisplay.overrideMessageDisplay({
  match: {
    fromAddress: /(?:auto-confirm|ship-confirm)@amazon.(?:com|ca)/
  },
  _totalRe: /Total(?: for this Order)?:[^$]+\$\s*(\d+\.\d{2})/,
  onDisplay: function(aGlodaMsg, aMimeMsg, aMsgHdr) {
    let bodyText = aMimeMsg.coerceBodyToPlaintext(aMsgHdr.folder);
    let match = this._totalRe.exec(bodyText);
    let total = match ? match[1] : "hard to say";
    return {
      html:
      <>
        <style><![CDATA[
          body { background-color: #ffffff; }
          .amount { font-size: 800%; }
        ]]></style>
        <body>
          you spent... <span class="amount">${total}</span>
        </body>
      </>
    };
  }
});

The modified version of Jetpack can be found here on the “thunderbird” branch. “about:jetpack” can be triggered from the “Tools” menu. Besides the development jetpack, you can also add jetpacks from the about:jetpack “Installed Features” tab by providing a URL directly to the javascript file. Unfortunately, I just tried installed more than one Feature at the same time and that fell down. I’m unclear if that’s a Thunderbird content issue, a problem with my changes, or a problem in Jetpack/Ubiquity that may go away when I update the branch.