Doccelerator: JavaScript documentation via JSHydra into CouchDB with an AJAX UI

doccelerator-1

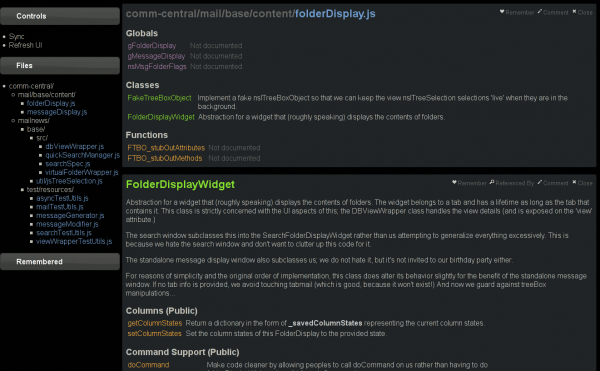
About the name.  David Ascher picked it.  My choice was flamboydoc in recognition of my love of angry fruit salad color themes and because every remotely sane name has already been used by the 10 million other documentation tools out there.  Regrettably not only have we lost the excellent name, but the color scheme is at best mildly irritated at this point.

So why yet another JavaScript documentation tool:

  • JavaScript 1.8 support.  JSHydra (thanks jcranmer!) is built on spidermonkey.  In terms of existing JS documentation tools out there, they can be briefly lumped into “doesn’t even both attempting to parse JavaScript” and “parses it to some degree, but gets really confused by JavaScript 1.8 syntax”.  By having the parser be the parser of our  JS engine, parsing success is guaranteed.  And non-parsing tools tend to require too much hand labeling to be practical.
  • Docceleterator is not intended to be just a documentation tool.  While JSHydra is still in its infancy, it promises the ability to extract information from function bodies.  Its namesake, Dehydra, is a static analysis tool for C++ and has already given us great things (dxr, also in its infancy).

doccelerator-comment

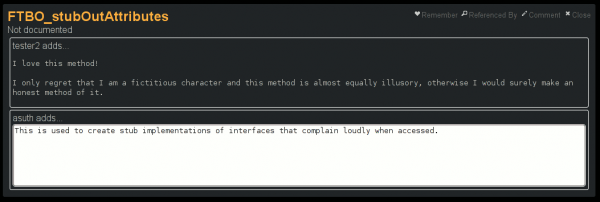
  • Support community API docs contributions without forking the API docs or requiring source patches.  DevMo is a great place for documentation, but it is an iffy place for doxygen-style API docs.  Short of an exceedingly elaborate tool that round-trips doxygen/JSDoc comments to the wiki and user modifications back again, the documentation is bound to diverge.  By supporting comments directly on the semantic objects themselves[1], we eliminate having to try and determine what a given wiki change corresponds to.  (This would be annoying even if you could force the wiki users to obey a strict formatting pattern.)  This enables automatic patch generation, etc.
  • Mashable.  You post the JavaScript source file to a server running the doccelerator parser.  You get back a JSON set of documents.  You post those into a CouchDB couch.  The UI is a CouchApp; you can modify it.  Don’t like the UI, just want a service?  You can query the couch for things and get back JSON documents.  Want custom (CouchDB) views but are not in control of a documentation couch?  Replicate the couch to your own local couch and add some views.
  • Able to leverage data from dehydra/dxr.  Mozilla JS code lives in a world of XPCOM objects and their XPIDL-defined interfaces.  We want the JS documentation to be able to interact with that world.  Obviously, this raises some issues of where the boundary lies between dxr and Doccelerator.  I don’t think it matters at this point; we just need internal and API documentation for Thunderbird 3 now-ish.
  • A more ‘dynamic’ UI.  The UI is inspired by TiddlyWiki‘s interface where all wiki “pages” open in the same document.  I often find myself only caring about a few methods of a class at any given time.  Documentation is generally either organized in monolithic pages or single pages per function.  Either way, I tend to end up with a separate tab for each thing of interest.  This usually ends in both confusion and way too many tabs.

1: Right now I only support commenting at the documentation display granularity which means you cannot comment on arguments individually, just the function/method/class/etc.

Example links which will eventually die because I’m not guaranteeing this couch instance will stay up forever:

The hg repo is here.  I tried to code the JS against the 1.5 standard and generally be cross-browser compatible, but I know at least Konqueror seems to get upset when it comes time to post (modified) comments.  I’m not sure what’s up with that.

Exciting potential taglines:

  • Doccelerator: Documentation from the future, because the documentation was doccelerated past the speed of light, and we all know how that turns out.
  • Doccelerator: It sounds like an extra pedal for your car and it’s just as easy to use… unless we’re talking about the clutch.
  • Doccelerator: Thankfully the name doesn’t demand confusingly named classes in the service of a stretched metaphor.  That’s good, right?

Review Board and Bugzilla reviews, take 2.

review-board-diff

Last time I played with Review Board and bugzilla request queues things were great for me, but no one else.  I had to create an account for you on the instance, add you to my script that synchronizes request queues, run the script, and then keep running the script periodically.  Not to mention there wasn’t really a way to get your review out and into bugzilla.  No one actually tried to use it, so they probably also didn’t notice there were caching issues related to the ever-changing definition of “HEAD” (“tip”).  It sucked, and when I upgraded and everything broke, no one cared, not even me.

But now it’s back and better than ever:

review-board-bugzilla-queue-sync

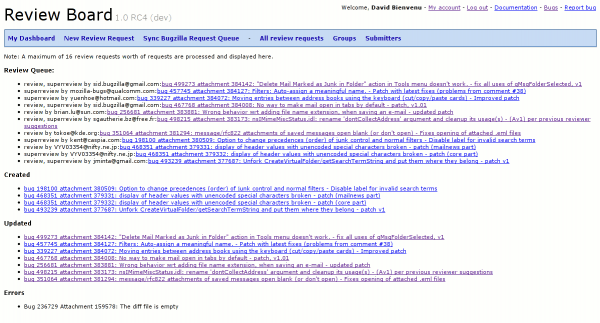
  • People don’t need to login at all to see review requests and reviews!  Just point them at the URL and away they go.  (Actually, this was the case before, but it was not obvious.)
  • You can/must sign in with Open ID!  If you have Weave and are reading this in the future, Weave can be your Open ID friend!  If you are like me and live in the present (Weave 0.3.2), something is wrong and it doesn’t work, not to mention that Weave takes over the Open ID box so you can’t use credentials that work.
  • There’s a button that updates your request queue for the 16 most recent requests made of you.  Just make sure that you have entered your bugzilla e-mail address on the “my account” page.  This may have happened automatically depending on what your Open ID provider provided/you told them to provide.
  • There’s export functionality so you can take your review and cram it in bugzilla.
  • The definition of “tip” gets nailed down when the review request gets created, so no more ugly caching issues.  Patches can still fail to apply, though, if “tip” has drifted from when the patch was first created.
  • It has friendlier assumptions about what repo you are dealing with.  Thunderbird/MailNews Core/Calendar/SeaMonkey are all assumed to be in comm-central, everyone else is assumed to be in mozilla-central.  Patches against other repos (including mozilla 1.9.1) clearly will not work without additional logic (and some kind of extra info, like people putting “1.9.1” in their attachment descriptions.)

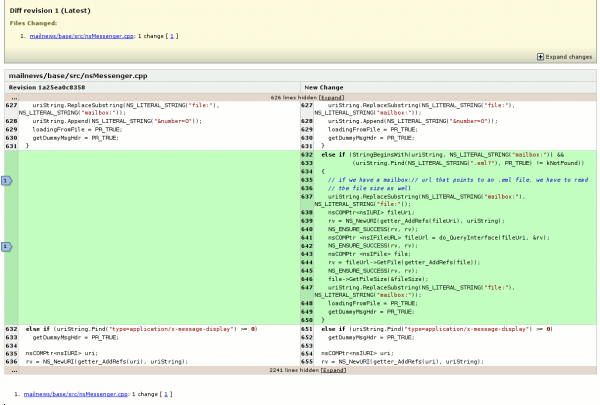
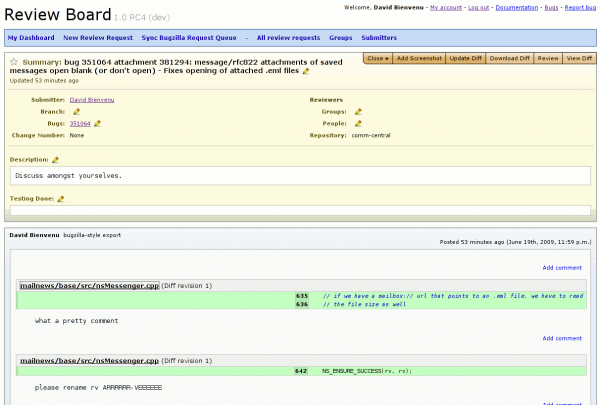
Here is a (fake) example of the “pretty” review output that is possible if you tell people about your reviewboard review (see it live here).  Although it says Bienvenu, it’s just me pretending to be him because his review queue is more interesting than mine.  The comments are accordingly mine.

review-board-review-pretty

Now, what does the export look like (see it live here)?

on file: mailnews/base/src/nsMessenger.cpp line 635
>     // if we have a mailbox:// url that points to an .eml file, we have to read
>     // the file size as well

what a pretty comment

on file: mailnews/base/src/nsMessenger.cpp line 642
>     NS_ENSURE_SUCCESS(rv, rv);

please rename rv ARRRRRR-VEEEEEE

Yeah, it looks like that.

A quick feature summary that explains why this is better than just looking at diffs in bugzilla:

  • Syntax highlighting!
  • It actually has the full-context of the rest of the file!  No more being limited to the 3 or 8 lines of context in the diff you are provided.  I know I have done a lazy review and let a bug through that would not have happened if I had more context at my fingertips (or was not sometimes lazy).
  • People just trimming down your patch to what they are commenting on leaves you with no context of what changed at all!

Useful links:

  • A more interesting live diff to check out.
  • The root of the review board that will prompt you to login via an Open ID account.  When syncing your review queue, please keep in mind that it can take a bit to do all the legwork and you won’t see any feedback until it is actually done doing everything else.  You should get some form of feedback no matter what happens, so don’t keep hitting refresh.
  • The hg repo for my modified version of review-board.  It’s based on an extremely shallow hgsvn checkout.  My questionable development strategy was to make changes with emacs locally, commit, then push to my VM, so the changesets are sometimes a bit excessive.

Caveat usor:

  • This is running on a linode VM right now.  This is better than my local box or what not, but it’s not Mo[MC]o IT or anything.
  • My changes, at least the export functionality, may be buggy.  You may need to rely on me to fix the export functionality to get your stuff out that way.  (If the hg diff doesn’t apply cleanly, you can’t enter data to lose it, so I’m less concerned about that.)
  • I have no plans to blow away the database, but at the same time, please be prepared for the possibility that space ninjas destroy your data.  Use the export functionality and save it to a text file or something periodically if you’re doing a major review.  (In case it’s not obvious, the export functionality is the text labeled “bugzilla-style export” to the right of the reviewer’s name at the top-left of each review.)  You can do your review in multiple passes, exporting each review pass individually.
  • I am confident something will go wrong.  Feel free to post comments here or ping me on IRC (:asuth).
  • If people actually try using this, I’ll stop developing on the live server, but do be aware that apache restarts (lasting a few seconds) may periodically happen, but this should not really impact anything.

Props:

Using BugXhibit to find that bug you know you saw recently but can’t find

bugxhibit-cc-search

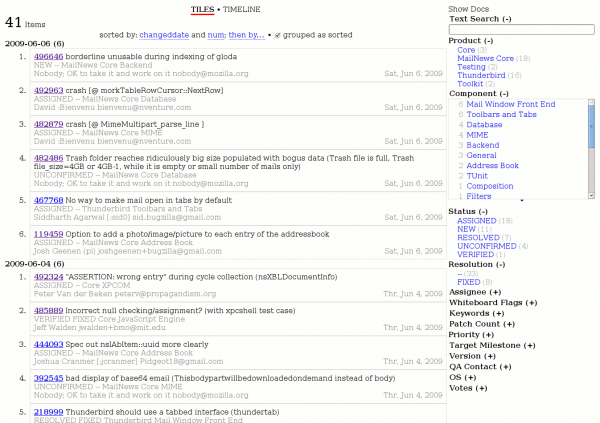
BugXhibit, the Bugzilla search results viewer made with the SIMILE Exhibit widget, is now more fancy, and now addresses another one of my use cases.  I frequently find myself wanting to point someone at a bug, or go back to a bug that I know passed through my bugmail recently, and have trouble finding it.  So now BugXhibit can do easy searches based on reporter/assignee/cc/commenter with time ranges.

Examples by way of live links this time (noting that the default time interval is 7 days).  Uh, and if it gives you an error for reasons I don’t fully understand if you open it in a new tab (in the background) from here, just hitting enter in the address bar should fix it.  I’m going to lazyweb that problem for now.

Other changes:

  • It now is also self documenting, just click on “Show Docs” on the page.
  • You can now use arguments to specify the sort and whether grouping is active on the page.
  • The date parsing is better.  Bugzilla doesn’t provide the raw dates but attempts to change things based on how recent the date is.  BugXhibit does a good job of fixing up the date if you are in the same timezone as the bugzilla server, and a less good but acceptable job if you aren’t.
  • Upgraded to exhibit 2.1.0 and now the numeric sliders with histograms work for me.  Woo!

Other notes:

The hg repo is here, as always.

DevMoXhibit: Exhibit on DevMo (Deki Wiki) results

devmo-search-customize-toolbar

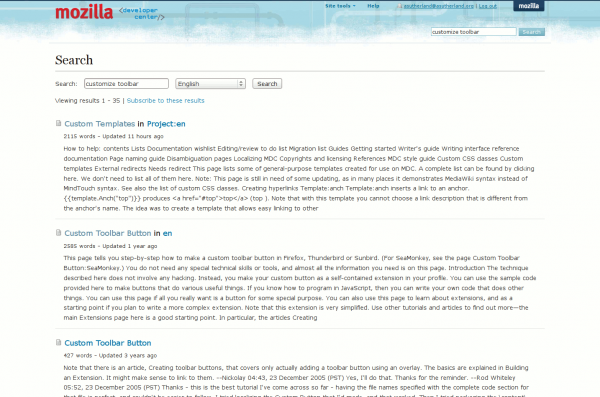
The above screenshot is of a normal search query on DevMo for “customize toolbar”.  I see 2.5 results, and I honestly have no interest in the first item at all.  (It’s a page that only advanced DevMo authors would care about, for those who refuse to squint or click on images to see bigger versions of images.)

devmoxhibit-search-customize-toolbar-corrected

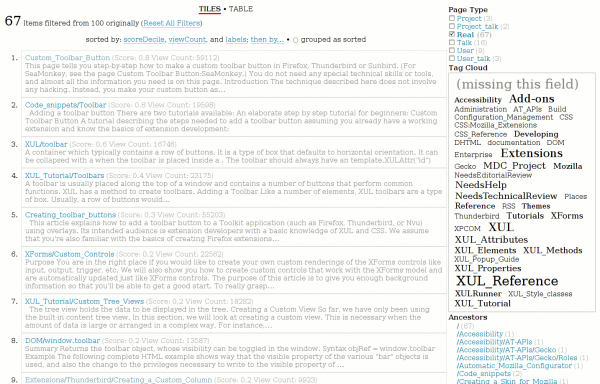
The above screenshot is of the same query using DevMoXhibit.  You will note you can see more things, and the first result from the other page is completely elided because we filter by default so that only “Real” result pages are shown.  (In general, I am not looking for talk pages or user pages or meta-pages.)

But enough about my interpretations of pictures, why don’t you:

Neat things we do that may not be immediately obvious:

  • We flatten the score into deciles, and then within each decile range we sort based on the view count for the page.  The theory is that, given equally likely results, the one that more people have looked at is probably more interesting to you, roughly speaking.
  • We use a simple heuristic to figure out the page type, as mentioned above (“Real”, “Talk”, “User”, etc.)
  • We try and hide all things related to the language, as we explicitly query on a language which means it’s just noise.  Right now, that language is always english, but the code uses a variable if you want to write the code to hook that up and expose it in the UI.
  • We produce a “smart” snippet.  The snippets provided by the search results naively will include “chrome” that is part of the document, which makes for a nearly useless snippet.  For example, take a gander at XUL/toolbar:
    • Plain old snippet:
      • « XUL Reference home    [ Examples | Attributes | Properties | Methods | Related ] A container which typically contains a row of buttons. It is a type of box that defaults to horizontal orientation. …
    • Smart snippet:
      • A container which typically contains a row of buttons. It is a type of box that defaults to horizontal orientation. …
  • We produce a sometimes over-zealous smart snippet.  If you were to keep reading both of those snippets, you would notice that the smart snippet eats a bit that the non-smart-snippet does not.  That is because the smart snippet is based on looking at a version of the snippet which has HTML tags in it, and then it tries to nuke those HTML tags out of existence using simple regexps.

Implementation notes:

  • This probably should work on other deki wikis if so adapted, but I don’t use any others, so YMMV.
  • We actually issue two search queries because there are two result formats that can be produced.  “xml” is an inexplicable mixture of too much data and too little data.  Namely, it does not tell you the tags on a document, which is basically the most useful piece of info, but it does tell you every link to and from that page (which we expose, although I doubt it will be useful enough to justify it).  It does give you a link to be able to get the tags, but that’s a costly operation when you have to perform it for each search result.  In contrast, “search” gives you the tags; they are only space-delimited, but that’s fine.  (“Inexplicable” may be a bit harsh; looking at the source, it’s just dumping the page info without further processing/lookups, but arguably it would be very useful if they made the effort to fetch that data.)
  • Because of cross-site XHR issues, this is not quite as hackable as I would like.  My demo server above is using mod_proxy (with a very specific constraint) to proxy the search to DevMo.  When I develop locally, I have to do the same thing.  Presumably if you are using Firefox 3.5 and devmo is set up correctly, then this would not be a problem.  But, 1) for no good reason, I only use Firefox 3.0 and 2) have no clue whether devmo is emitting the headers that would enable that to work.  I strongly encourage someone to look into #2 and fix it if not.
  • As with BugXhibit, the sliders are totally broken for me and it’s sad, but I left them in there in the hopes that they work for someone, somewhere.  Alternately, I would not complain if someone, somewhere, fixed them.

The hg repo is here.

BugXhibit: Exhibit on Bugzilla results

bugxhibit-timeline

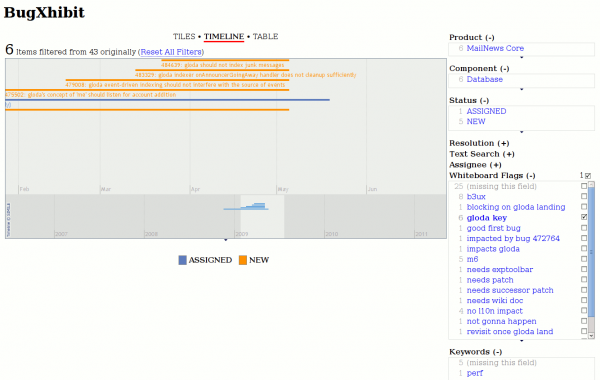
I know it has sorta been done before (found via Bugzilla Fixup Wiki Page on a comment by faaborg), and I feel like there has to be another live version somewhere, but here we are.  BugXhibit is an MIT SIMILE Exhibit widget fronting a bugzilla.mozilla.org quicksearch query.

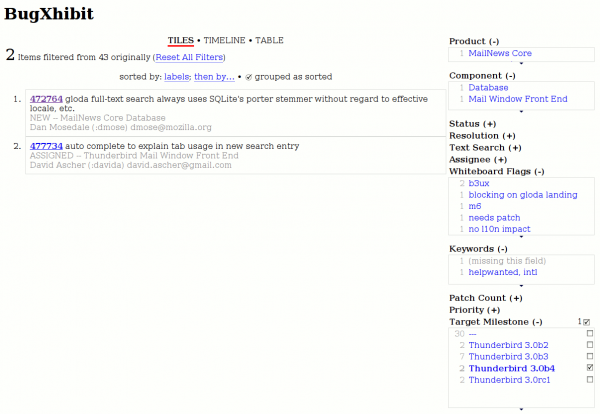
Click here to go to a BugXhibit page where you can enter your own query.  Enter “gloda” if you want to see what the screenshots are based on.  I feel like it would be improper of me to provide a link with a live query though.

Go visit the hg repo.  Or just download the source from the previous link.  Please improve!  (See the SIMILE Exhibit docs for how to do that.  It’s all really easy.)

bugxhibit-tile-view

Notes:

  • This uses bugzilla’s ctype=js for buglist.cgi.  It apparently has been around since 2003 (bug)!  And thanks to Gerv!  Perhaps not too surprisingly, the format of the results is not inert JSON but live JS code that builds a would-be-Array where each bug’s info is stored in an array.  What each element in the array stands for cannot be known from the results.  I find that using ctype=csv is a good way to get the headers.  Rather than doing that every time (cost concerns on the redundant query), I did it once for columnlist=all (which we always use) and stashed it in bugxhibit.js.  This is dangerous because it is brittle; if you try and use bugxhibit against a saved search someone made public, I at least got many fewer columns (despite columnlist=all), and things just don’t match.  Not to mention there is a “cf_blocking_fennec” flag in there that I feel like should not be there.
  • It looks pretty easy to have bugzilla produce more sane JSON output via a template (although the security code that logs you out for a js request still should run, so don’t forget buglist.cgi.)
  • Even with all columns exposed when using buglist.cgi, there are lots of interesting things that are not exposed.  For example, flags are not exposed via buglist.cgi, so faceting on whether things are blockers or wanted can’t be done.  Once you know the bug numbers from the query, you can obviously go fetch additional information, though I think that currently still needs to be XML format, but that’s not that hard.
  • The code is friendly and splits up the whiteboard and keyword things so it does what you would expect and is not stupid.
  • I made sliders for patch count and votes.  They don’t work for me anymore, and I see XUL wrapper anger (on Firefox 3.0.x), so, uh, don’t be surprised if they fall down.
  • The UI obviously sucks.  But it’s a proof of concept, and you are the internet!  You can do anything!

Better error reporting for the mozilla platform

old-and-busted-error-reporting

If you develop for the mozilla platform, you might be used to error messages like the above.  (Or you might wish you got error messages like the above…)  An uncaught javascript exception has resulted in a message in the error console as well as some equivalent stdout spew because it’s a debug build.  While any error is better than no error, it doesn’t exactly narrow down how we got there.

Wouldn’t it be nice if we got back-traces for these errors?

new-error-reporting-hotness

The future is now, people!  And it comes in the convenient form of a patch against the 1.9.1 branch, just like you always dreamed!  Also, an extension.

Currently (pre-patch), there are basically 3 ways scripting errors can show up in the platform:

  1. nsIScriptError instances.  These are what show up on the error console.  These have information equivalent to a single stack frame.
  2. nsIException instances.  These can provide a stack in the form of an nsIStackFrame chain (the same thing Components.stack gives you).  These get converted into nsIScriptError instances when it comes time to report them to the error console.  From a stack perspective, only XPConnect produces nsIException instances with stack traces, although you can make your own via Components.Exception.  A fundamental limitation of these stack traces is that they are only constructed from live JS call stacks, so if a JS exception has unwrapped its way to the top-level you are out of luck.
  3. JavaScript Error instances.  These have a private super-rich (it even knows arguments!) call-stack that can only be exposed as a string via the non-standard stack attribute.  XPConnect understands JS error reports (the ‘flat’ mechanism by which SpiderMonkey reports errors/exceptions to C++ code), but it has no clue about exceptions and their Error form of existence.  The exceptions in their error report guise are converted into nsIScriptError instances.

What the patch (on bug 493414) does is:

  • Introduce an nsIScriptErrorEx interface that extends nsIScriptError to provide a ‘location’ attribute like nsIException which is an nsIStackFrame.
  • Modify nsScriptError to implement the extended nsIScriptErrorEx.  Alternatively, I could have made XPConnect’s nsXPCException class implement nsIScriptError or nsScriptError also implement nsIException or something like that and not introduced nsIScriptErrorEx at all.
  • Modify all nsIScriptError-creation sites that I care about (I’m not looking at you, DOM workers) to try and provide or propagate existing nsIStackFrame information.
  • If a JS stack frame is not available, but an exception is in the form of a JS error, suck the call stack out of it.  Theoretically, this should not be a fallback but rather the default case, but it depends on some JS/XPConnect implementation details I am trying to avoid finding out about for now.
  • Modify the JS API to provide call stack sucking functionality.
  • Does various sketchy things to expose XPCJSStack::CreateStack from XPConnect to the error reporters in other modules.  If you thought the choice of creating nsIScriptErrorEx was sketchy, welcome to the Downtown East Side of dubious patches.  I expect there is no chance of it working on Windows because of this, and you may be out of luck on OS X.  Behold your comeuppance, popular platforms!

What the extension (repo) does is:

  • Add an nsIConsoleListener at app-startup that is aware of nsIScriptErrorEx and knows how to generate totally wicked 256-color ANSI escape sequences.
  • Not expose the stack traces in the error console.  The error console is for suckers who don’t have impossibly fast reflexes and a love of XON/XOFF flow control.
  • Only target Thunderbird.  Behold your comeuppance, all other mozilla applications!  (The extension wizard didn’t know how to do the thing that makes it work on all xulrunner-based things…  feel free to push a fixed install.rdf to my repo.)

I have logged bug 493414 to hold the patch and hopefully track the effort moving forward.

displaying execution traces on a SIMILE timeline

chronimoz-timeline-1

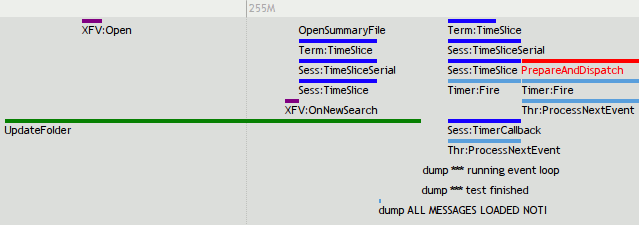
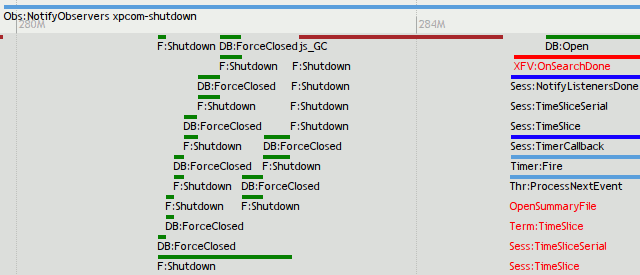
chroniquery can now output JSON for display using the SIMILE timeline widget.  And I am finally done trying to figure out what was going wrong.  Click the pictures to experience the timeline sensation for yourself.

Related interesting things:

  • Supports a fancy if specific constraint mechanism.  For example, PrepareAndDispatch is only displayed in the context of nsTimerImpl::Fire using the following line in the config file:
[func@PrepareAndDispatch]
only_show_if=backtrace,4,nsTimerImpl::Fire
  • Supports displaying arguments in the title using the config file.  For example, displaying the observer service’s topic (plus putting it in its own band and giving it a nice prefix):
[class@nsObserverService]
prefixAlias=Obs:
band=context
list_args=aTopic
  • We actually get the dump() output by logging where _IO_fputs shows up.  We constrain its output by adding an extensible (if currently somewhat specialized) argument-based constraint.
  • Things in red are red because their return codes were exceptional, per my last blog post.  Things in other colors are that way because of the config file.
  • The bubbles that show up when you click on things tell you the return value and arguments for the call in question.  We could include a backtrace, but they are expensive to compute (currently), so I don’t.
  • All layout is using the timeline widget’s layout.  There is no correspondence between stack depth and anything else.

chronimoz-timeline-2

An important limitation is that all functions displayed here were explicitly chosen for display.  Some form of automated mechanism could be used, but unless chronicle-query starts caching more things, it would be really slow.  Here’s the command-line used for the above:

chron-xpc mozrun-9022.db jsontrace -t 1 -f nsObserverService::NotifyObservers -f nsThread::ProcessNextEvent -f nsTimerImpl::Fire -f nsMsgSearchSession::NotifyListenersDone -f nsMsgDBFolder::Shutdown  -f nsMsgLocalMailFolder::AddMessage -f nsMsgDatabase::Open -f nsMsgDatabase::ForceClosed -f nsMsgLocalMailFolder::GetDatabaseWithReparse -f nsMsgDBFolder::OnAnnouncerGoingAway -f nsMsgDBFolder::AddSubfolder -f nsMsgSearchOfflineMail::OpenSummaryFile -f nsMsgSearchSession::TimerCallback -f nsMsgSearchSession::TimeSlice -f nsMsgSearchSession::TimeSliceSerial -f nsMsgSearchScopeTerm::TimeSlice -f nsMsgXFVirtualFolderDBView::Open -f nsMsgXFVirtualFolderDBView::OnNewSearch -f nsMsgXFVirtualFolderDBView::OnSearchDone  -f js_GC -f PrepareAndDispatch -f nsMsgLocalMailFolder::UpdateFolder -f _IO_fputs

understanding where unit tests go wrong with object diffs

chronimoz-diff-1

In our last chroniquery adventure, we used roc‘s chronicle-recorder to trace the execution of an xpcshell unit test and chroniquery (repo info) to use that trace to help us understand what was happening in some particularly confusing C-ish code.  Actually, we’re doing that this time too, but the bag of tricks now contains additional tricks.

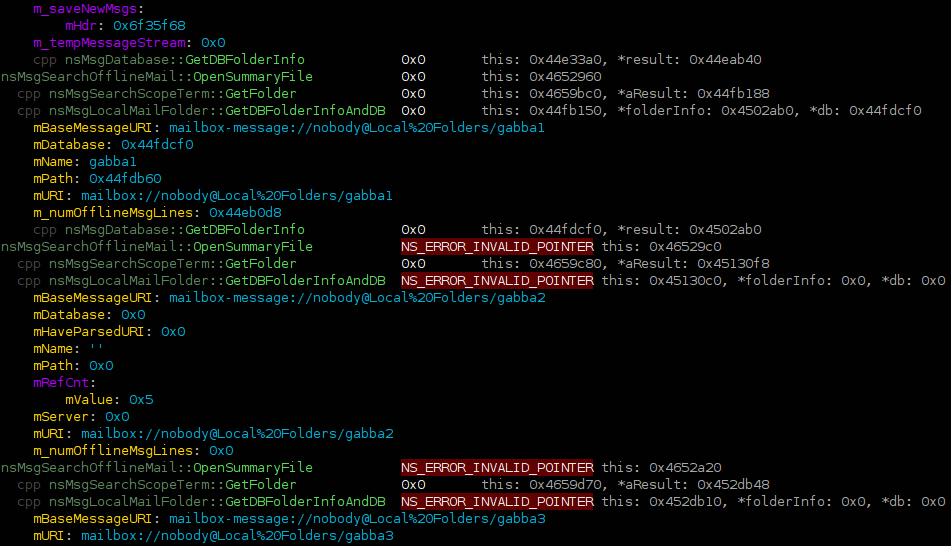
The exciting things happening in the screenshot above, in order of increasing awesomeness:

  • The argument list is exposing out-parameters (via a heuristic though, it doesn’t know the XPCOM details.)  ex: “*folderInfo: 0x0” used to be “folderInfo: some pointer to hold an out-parameter that leaves us none the wiser.”
  • Chronifer now sees through ‘this’-adjusting trampolines/wrappers.  Previously, function calls might be hidden because the stack pointer change that chronicle uses to determine function calls jumped to the trampoline whose bytecode was not associated with the actual function being called, and so would potentially be assumed to be boring.  The trampoline would modify rdi then perform a trivial jump (it could have just fallen through) into the function proper, which the existing trampoline detector would not notice.  (That detector only would notice an instant jump of more than 128 bytes; intended for dynamic linking indirection purposes.)
  • Pretty printers allow us to translate nsresult error codes to strings, display the strings referenced by nsString/nsCString instead of the raw structure (mData/mLength/mFlags), pierce nsCOMPtr’s, etc.
  • Pretty printers allow us to detect exceptional values and show them in red!  For example, that NS_ERROR_INVALID_POINTER is red because the nsresult pretty printer’s is_exceptional method returned True because the error bit was high.
  • The configuration method that lets us say what directories/files/classes/functions are interesting/boring has been augmented to let us specify arguments and the sub-fields of arguments to dump.  For example, in the above screenshot, we have added “dump_this=True” to the section labeled “[class@nsMsgLocalMailFolder]”.  As a result, any time a method is called on nsMsgLocalMailFolder, we dump the contents of its ‘this’.  If we only wanted a few fields from “this”, we could have used “dump_this=mPath,mIsServer,mName,mURI” instead.  You can see the end of a full object dump at the top of the screenshot.
  • The object dump output is diffed against the result of previous calls.  This is why we have that text in yellow.  The first entire GetDBFolderInfoAndDB call you see on the screen is a succesful call (no red!) diffed against a previous successful call.  Mainly we see the name-derived things changing and things we expect to be distinct (file path, database).  Then we have an error case, with a few things we probably would not have noticed if we were doing this by hand.  I was somewhat surprised that mHaveParsedURI, the reference count, and m_numOfflineMsgLines showed up.  The others are not entirely shocking, but it’s useful to have them all there.  Without the diff, we would be looking at 65 lines of attribute values, and that is with us already benefitting from the pretty printers.

Exciting possibilities opened by enhancements here:

  • The pretty printers and internal cleanups/refactoring make it feasible to express complicated data-based constraints simply.  For example, with a tractable amount of work I could opt to only see calls on the folder named “gabba3” using the constraint “mURI == ‘mailbox://nobody@Local%20Folders/gabba0′”.  This could be made particularly efficient if we make an assumption that the attribute is invariant once observed and then allow us to key off the pointer/memory region.
  • Code-sharing of pretty printers between my chroniquery code and my archer gdb plugins.
  • Now that archer-gdb has python inferior control, potential use of archer-gdb as an alternate back-end to chroniquery.
  • It would be neat to be able to expose chroniquery’s functionality via a web interface so that things could be expanded/drilled down without having to re-run things.  This would also help offset the non-trivial startup costs to chronicle-recorder’s own chronicle-query.  (Although arguably the startup time is nothing compared to the inefficiency of all the work chronicle-query does for a call and throws away when the next call pretty much wants that same data.)

gaudily syntax-highlighted code listings in (archer) gdb

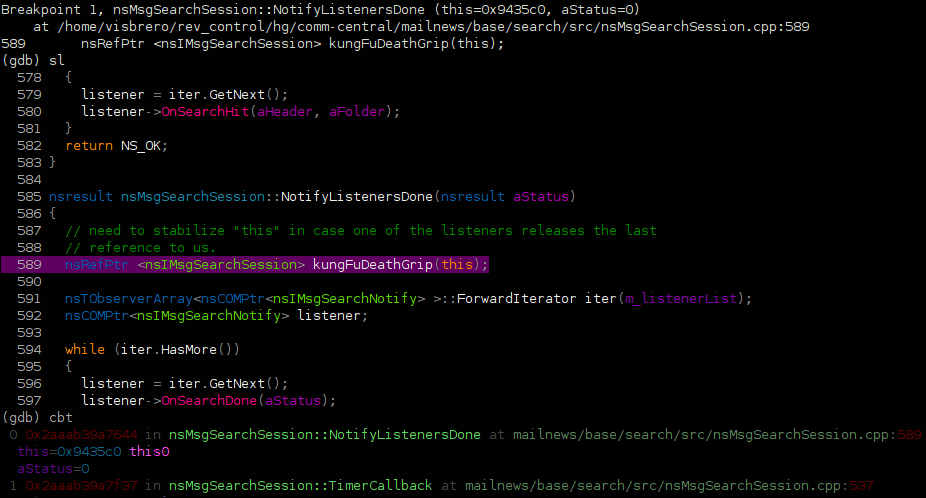
pyglist sl command output

Gaudily syntax-highlighted code listing in gdb joins the gaudy gdb plugin family!  (Other members include gaudily colorized backtraces, which you can also see in the bottom of the screenshot.)  This, of course, requires gdb with python crammed inside.  It might require one crammed a few months ago too; I haven’t updated my archer-gdb repo for at least that long.

The “sl” plugin uses Pygments for the syntax highlighting.  Although pygments has a 256 color terminal formatter (woo!), I ended up using my pyflam module because it did not support my need to color the background of the current line without doing something convoluted.  (I would have had to create a filter that did its own line-counting and created background-color-styled token variant of every token on the desired line.)  Also, it didn’t do line numbers.

The color theme is based off the “fruity” color theme.  Much of the gaudy comes from a filter I added that tries to do various Mozilla C++-aware code styling things by recognizing naming patterns of Name tokens.  Before you complain about the colors hurting your brain, remember that this is the alternative:

not-pyglist, standard list command

That’s right.  It’s like looking at static.  You can barely make anything out.  And imagine if it was more than just the 10 lines “list” gives you.

Anywho, the repo is here: http://hg.mozilla.org/users/bugmail_asutherland.org/pythongdb-gaudy/

The README tells you what to do.  For complete-ness, and because I went to all the effort to write documentation for the command, here is what it does!

Prints a syntax-highlighted source listing.  Currently limited to only
work based on the current debug frame and position.

By default, the 11 lines before the current position and 8 lines after are
displayed.  A line context is saved between command invocations if the current
source line does not change.

Arguments when used in a new context:
  (none)  Shows the 11 lines before the current position and 8 lines after.
  N       Shows the N/2 lines befores the current position and N/2 lines after.
  -N      Shows the N lines before the current position and 8 lines after.
  +N      Shows the 11 lines before the current position and N lines after.
  M N     Shows the M lines before the current position and N lines after.

Arguments in an existing context:
  (none)  Shows the 20 lines after the last-shown lines.
  -       Shows the 20 lines preceding the last-shown lines.
  N       Shows the N lines after the last-shown lines.
  -N      Shows the N lines preceding the last-shown lines.
  M N     Shows the M last lines of the last-shown lines and N lines after the
            last-shown lines.

Arguments regardless of context
  @A,B    Shows lines A through B.

thunderbird, gloda, exptoolbar, protovis, paninaro, oh oh oh

exptoolbar-protovis-gloda-256

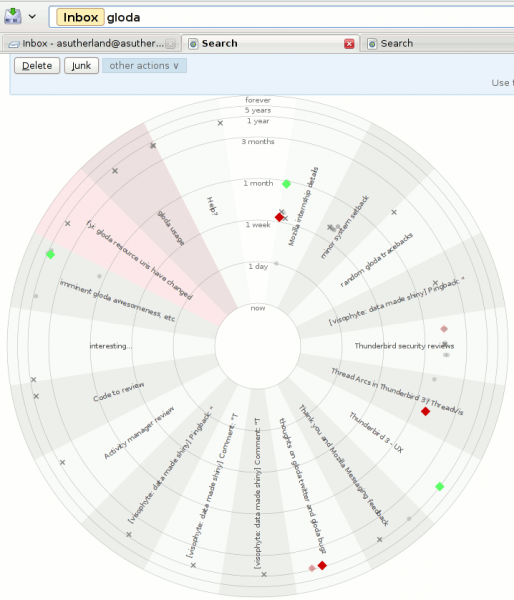
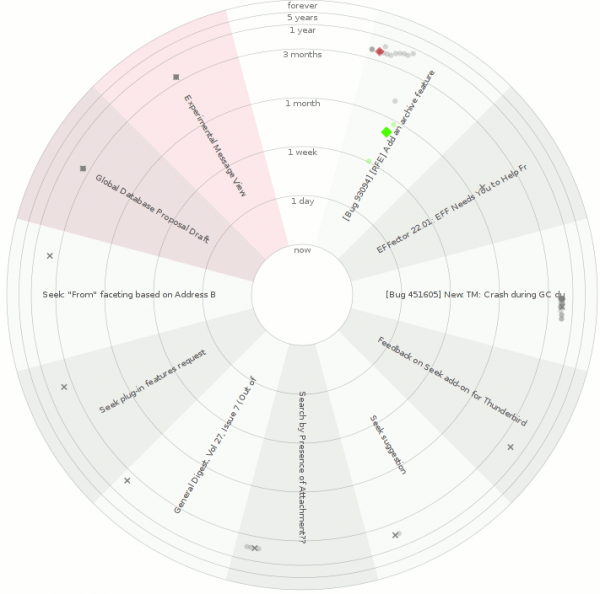
Thunderbird.  With the global database, gloda.  Using the exptoolbar extension.  Using the protovis javascript visualization library.  For reals!  Not a prank!  Just grab the most recent XPI or grab the repo.  And be using a nightly (beta 2 might work?)

What you are looking at:

  • The exptoolbar search results page, augmented with a visualization.
  • Each conversation with search results gets its own wedge.
    • Wedges can be distinguished because of the alternating background colors.
    • Conversations that you sent a message to will have a red shading to them.  The examples may be somewhat misleading because the account where a lot of my sent mail ends up is not part of the profile used to create the screenshots.
  • Each message is placed in its conversation wedge…
    • The radius is based on the ‘age’ of the message using a log-ish scale.  Interpolation is actually linear at each level (one day, one week, one month, three months, one year, 5 years, ‘forever’.)
    • The angular placement within the wedge is based on the author of the message.  Across all wedges the placement is the same.  This helps ‘bursty’ parts of conversations (which are extremely likely) be made more obvious, while also helping to provide some understanding of conversation dynamics.
  • Message shapes are determined by whether the message is starred (diamond), sent by a ‘popular’ contact (circle), or an unpopular one (cross).  The use of popularity is a temporary measure because current gloda in trunk does not cache address-book lookups, and they are expensive.  Once the new gloda search code lands with those changes, we can rely on the existence of an address book entry.  (Starring a contact using the new message reader adds them to your address book.)
  • Message opacity is determined by whether the message is a ‘hit’ or not.  All messages in a conversation are eventually retrieved, though initially we only have the hits.
  • Message color is determined by applied tags (using the closest tango color for the first tag), or whether the message is starred (closest tango color to yellow, where I think I had removed the yellow tango colors for some unknown reason, so we get green I guess).  It’s grey if the message has no tag or star.
  • The subject of the conversation is displayed in the wedge.

exptoolbar-protovis-seek-thunderbird-256

Things that are happy:

Things that are sad (aka caveats):

  • It would probably be better if the visualization was not radar-inspired.  Besides the perceptual reasons, the subjects are harder to read than they would be in an equivalent linear-styled visualization.
  • The visualization is not interactive.  protovis officially has no interaction support yet, but if you look in the (only available minified?) source, it’s almost there.  It might be entirely there, but it didn’t work for me immediately after a quick reading of the (indented) source.
  • There is some low probability failure that occurs during the visualization updating as gloda backfills the message collections.  If it happens on the last update, you can end up with a half-built visualization.  Re-running the search will generally resolve the issue.
  • The visualization does a pretty solid job of taking up all the screen real estate and has no way to be disabled, so you have to scroll past it every time.

Future work:

  • Interactivity.
  • Perhaps showing the gravatars for the people involved in a conversation at the outer rim of the wedge, positioning them based on the author positioning we determined.
  • Perhaps lose the radar motif.
  • Your thoughts / patches!