understanding libmime using chroniquery and unit tests

chroniquery-trace-failed-return-value

Mailnews’ libmime is one of the harder modules to wrap one’s head around.  8-letter filenames where the first four letters tend to be “mime”, home-grown glib-style OO rather than actual C++, and intermingling of display logic with parsing logic do not make for a fun development or even comprehension experience.

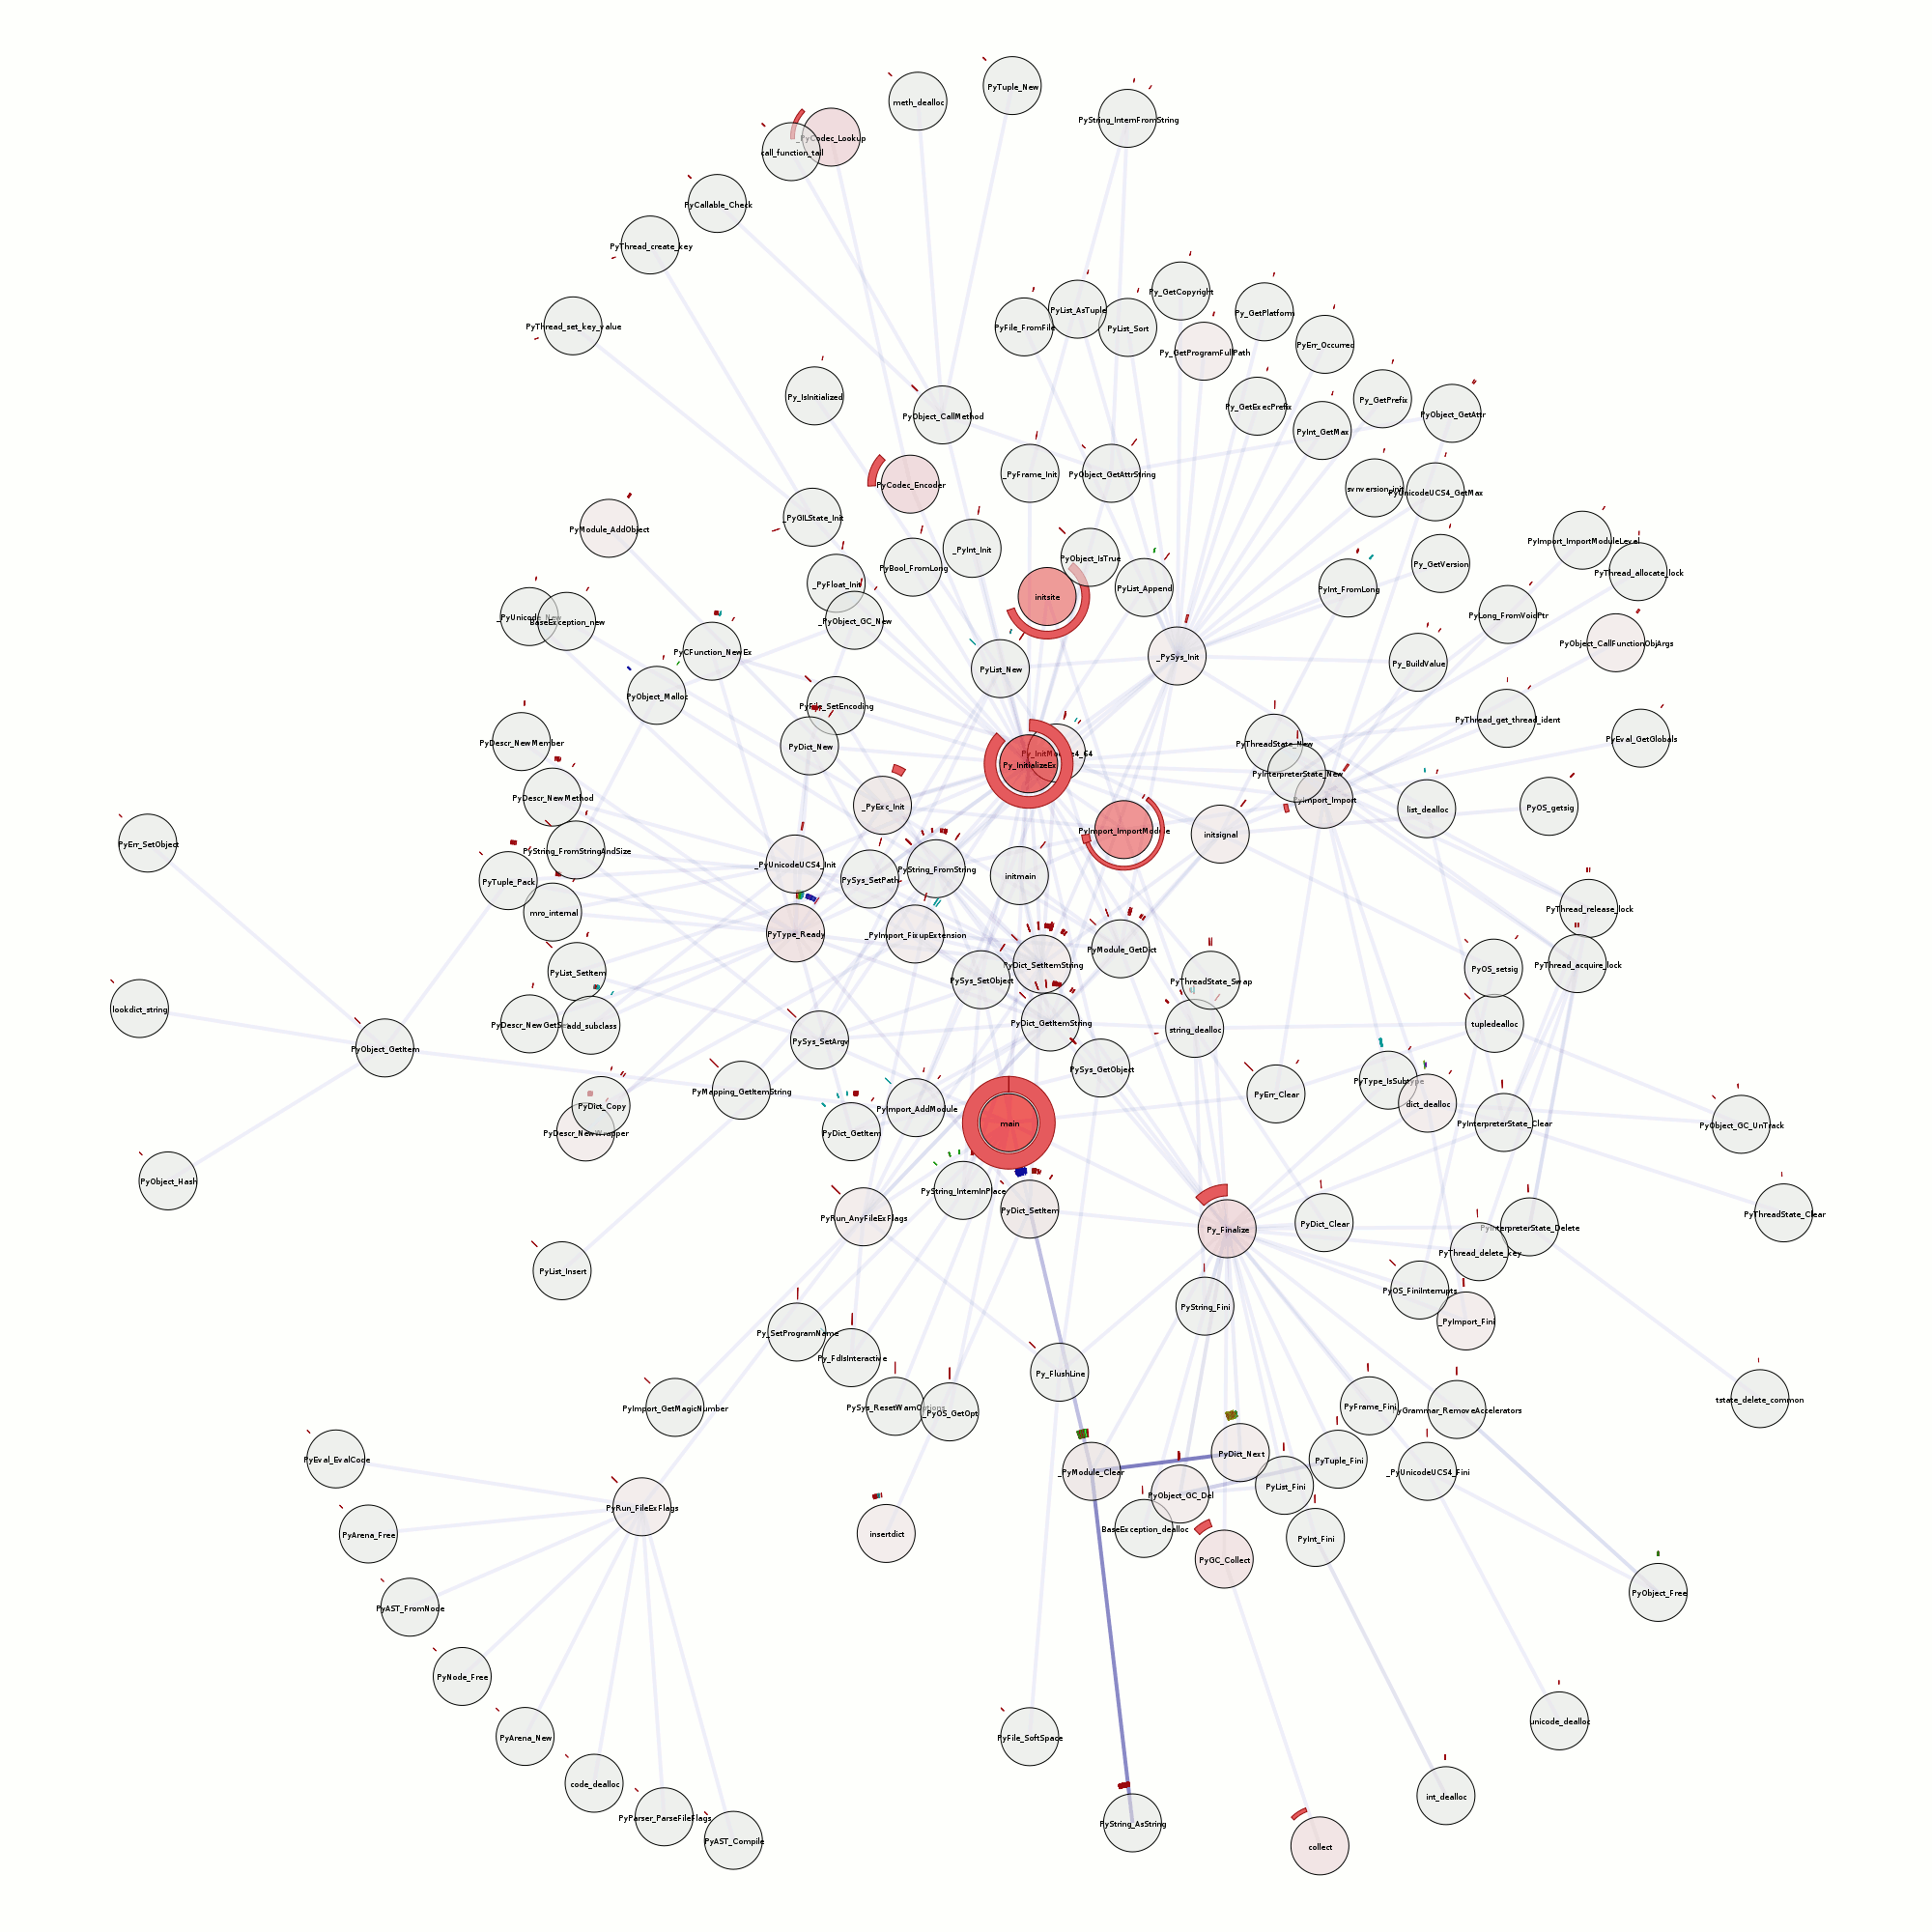
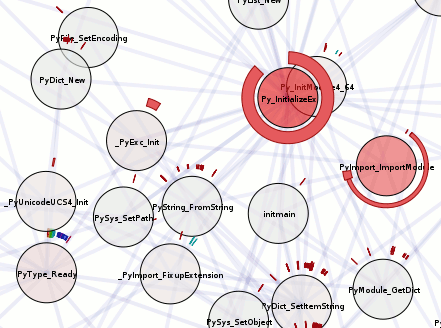
Running an xpcshell unit test run under roc‘s chronicle-recorder and then processing it with my chroniquery stuff (repo info), we get a colorful HTML trace of the execution somewhat broken out (note: pretend the stream_write/stream_completes are interleaved; they are paired).  Specific examples of libmime processing for the inquisitive (there are more if you check the former link though):

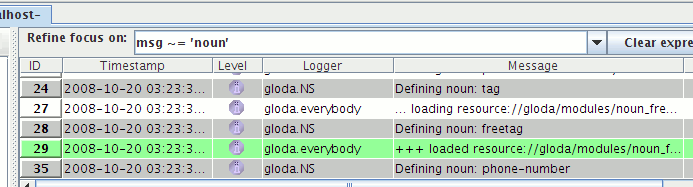
The thing that kickstarted this exciting foray is the error pictured in the screenshot above from an earlier run.  The return values are in yellow, and you can see where the error propagates from (the -1 cast to unsigned).  If you look at the HTML file, you will also note that the file stops after the error because the functions bail out as soon as they hit an error.

However, our actual problem and driving reason for the unit tests is the JS emitter choking on multipart/related in writeBody (which it receives by way of ‘output_fn’).  Why?  Why JS Emitter?!  (You can open the links and control-F along at home!)

  • We look at the stream_write trace for our multipart/related.  That’s odd, no ‘output_fn’ in there.

chroniquery-stream_complete-output_fn

  • We look at the stream_complete trace for the multipart/related.  There’s our ‘output_fn’!  And it’s got some weird HTML processing friends happening.  That must be to transform links to the related content into something our docshell can render.  This also explains why this processing is happening in stream_complete rather than stream_write… it must have buffered up the content so it could make sure it had seen all the ‘related’ documents and their Content-IDs so it could know how to transform the links.
  • Uh oh… that deferred processing might be doing something bad, since our consumer receives a stream of events.  We had to do something special for SMIME for just such a reason…
  • We check stream_complete for ‘mimeEmitterAddHeaderField’ calls, which the JS emitter keys off of to know what part is currently being processed and what type of body (if any) it should expect to receive.  Uh-oh, none in here.

chroniquery-stream_write-addheaderfield

  • We check stream_write for ‘mimeEmitterAddHeaderField’ calls, specifically with a “Content-Type” field.  And we find them.  The bad news is that they are apparently emitted as the initial streaming happens.  So we see the content-type for our “text/html”, then our “image/png”.  So when stream_complete happens, the last thing our JS emitter will have seen is “image/png” and it will not be expecting a body write.  (It will think that the text/html had no content whatsoever.)
  • Khaaaaaaaaaaaaaaaaaaaaaaaaan!

In summary, unit tests and execution tracing working together with pretty colors have helped us track down an annoying problem without going insane.  (libmime is a lot to hold in your head if you don’t hack on it every day.  also, straight debugger breakpoint fun generally also requires you to try and formulate and hold a complex mental model… and that’s assuming you don’t go insane from manually stepping aboot and/or are lucky with your choices of where you put your breakpoints.)  The more important thing is that next time I want to refresh my understanding of what libmime is up to, I have traces already available.  (And the mechanics to generate new ones easily.  But not particularly quickly.  chronicle and my trace-generating mechanism be mad slow, yo.  It may be much faster in the future to use the hopefully-arriving-soon archer-gdb python-driven inferior support, even if it can’t be as clever about function-call detection without cramming int 0x3’s all over the place.)

Useful files for anyone trying to duplicate my efforts: my ~/.chroniquery.cfg for this run, the unit test as it existed, and the command-line args were: trace -f mime_display_stream_write -f mime_display_stream_complete -c -H /tmp/trace3/trace.html –file-per-func-invoc

gaudily colorized gdb backtraces! woo!

pythongdb-gaudy-groupview-crash-1

Like many people who have overdosed on syntax highlighting and other forms of colorization, my brain is no longer able to process monochrome text displays.  Which is why I have been so excited about gdb with python crammed inside.  (The good sense of “crammed”, wherein one is cramming cookies in one’s mouth.)  I have perverted its spirit and used it to colorize gdb backtraces!  Woo!

While I was in there, I have done two useful things:

  • There is magic of limited potency that normalizes the path automatically.
  • It looks at all the values in the arguments (and locals too, I guess) and if they are used more than once, it considers making them “interesting”.  Interesting values get named based on where we first saw them, and assigned a color.  Then, whenever they appear in the backtrace, they get their special name and color to help us see the flow of values through the backtrace.  For example, in the screenshot above you can see “this5” in a nice* blue color.  Each time its value appears, the “this5” label appears (the 5 is for frame 5).  I find this easier than manually scanning using my brain.

My hg repo is here: http://hg.mozilla.org/users/bugmail_asutherland.org/pythongdb-gaudy/

If you like this, or if you don’t like this but do like useful things, you are even more likely to like Jim Blandy’s archer-mozilla repo which is full of magic debugging help for spidermonkey in gdb.  (nb: The python-gdb trunk right now has changed how pretty printers register, and I don’t think that repo has yet caught up.)  Also, see Tom Tromey’s blog posts about the whole python-gdb thing.

* When I use “nice” in terms of colors, this is from my perspective as someone who demands many colors, has the time to add crazy colors to everything, but inexplicably does not have the time to actually pick colors that humans find appealing (or even non-nauseating).  I am going to pass the buck to the people who originally conceived of 256-color xterms and thought I could be trusted with a color cube, no matter how limited.

dxrpy with references against mailnews, plus bespin wishes

dxrpy-nsimsgfolder-delete

bsmedberg‘s dxrpy likes to generate documentation using dehydra (bsmedberg’s blog posts on this: 1 2).  I have added support for references/referencedBy extraction and otherwise wailed on it a little bit, and run this against JUST comm-central’s mailnews/ directory.  The collection process is still strictly serial, and there’s a lot of stuff in mozilla-central/comm-central, which is why the subset.  You can find the outputs here.  My repository with my changes is here.  There are all kinds of issues and limitations, of course.

The picture above is of nsIMsgFolder::Delete(), the major advantage over mxr being that we’re not going to have ambiguity from completely unrelated Delete methods.  Note that in the mxr link I am cheating by not filtering to mailnews/, but the point is that with dxrpy you don’t need to do that.  The picture below shows a slice of the ‘references’ information for nsMsgDBView::Sort.  Another thing you could see is who is using nsVoidArray (in mailnews/!) by virtue of referencing its destructor.

dxrpy-nsmsgdbview-sort-references

My interest in this is a continuation of my efforts on pecobro to provide an interface to expose performance information from various means of instrumentation.  That such a thing requires a useful interface substrate is just a nice surprise.  The dehydra C++ stuff complements the references/referenced by work I did for javascript in pecobro.  Eventually I would hope to use the jshydra infrastructure to accomplish the js stuff since the parser pecobro uses is an unholy/brittle thing, and a usable jshydra would have all kinds of other exciting uses.

Things I would be very happy for other people to magically do so I don’t need to do them:

  • Magic up bespin so that it can pull files out of hg.mozilla.org.  One of the significant reasons I did not do more work on pecobro is that the approach of syntax highlighting in DOM explodes quite badly when confronted with source files you might find in mozilla-central/comm-central.
  • Make dxrpy generate json files representing the information it knows about each source file (positions => semantic info) as well as each function (positions in a function of references=> semantic info on those references).
  • Make bespin retrieve those json files when the file is loaded so that its naive syntax highlighting can be augmented to correlate with that semantic info.  One could attempt to be clever and use simple regexes or something to allow this information to be maintained while you edit the file, but I only need bespin to be read-only.
  • Make it easy for bespin to use that info to follow references and return without sucking.
  • Make something that extracts stack-traces from socorro and clusters this information by class, sticking it in static json files too, why not.
  • Make bespin use its semantic and just general line number info to grab the stack-trace crash info so that it can highlight code in bespin that is suspected to be crashy.  (You would probably want to get clever about determining what is a potentially innocent frame in the trace and what should be considered actually crasy.  Knowing when you’re calling out of your module is probably a simple and useful heuristic.)
  • Make something that chews the crash stacks with the dehydra/dxrpy data to make a visualization of where the crasy stuff is happening, module-wise.)
  • Make bespin retrieve json files of file/class-oriented json files that my performance tooling generates, letting me display cool sparkline/sparkbar things in the source.
  • Cleanup/infrastructurization of dxrpy’s generation/display mechanisms.  My greatest need of dxrpy is actually a coherent framework that can easily integrate with bespin.  The tricky part for my performance work is the javascript side of the equation, and the pecobro tooling actually does pretty well there.  It just wants to have a migration path and an interface that doesn’t cause firefox to lock up every time I change syntax-highlighted documents…

And if anyone already has a tool that is basically a statistical profiler that can do stack-traces that fully understand the interleaved nature of the C++ and spidermonkey JS stacks, that would be great.  (Bonus points for working with the JIT enabled!)  My dream would be a timer-driven VProbe based solution; then I could run things against a replay and avoid distortion of the timescale while also allowing for a realistic user experience in generating the trace.  I would like to avoid having to do trace reconstruction as I have done most recently with dtrace and chronicle-recorder.  I would not be opposed to a PythonGDB solution, especially if VMware 6.5 still provides a gdb remote thinger (did the eclipse UI make that disappear?), although that would probably still be more crossings than I would like and perhaps slower (if less distorting) than an in-process or ptrace based solution.

visualization of control-flow/data-flow analysis of sqlite EXPLAIN-ations

control-flow before

control-flow before

While doing some work on the gloda-based search targeted for beta 2, I came upon some query slowness and decided to look into it.  Because gloda queries are (conceptually, at least) dynamic, we also generate dynamic SQL.  Our schema is fairly normalized, and it’s not always obvious to me what I can expect to have going on.  EXPLAIN QUERY PLAN is a good litmus test for massive insanity, but it’s a bit concise.  For example, the troublesome SQL was as follows:

SELECT * FROM messages INNER JOIN messagesText ON messages.id = messagesText.rowid WHERE id IN (SELECT docid FROM messagesText WHERE subject MATCH "sutherland") AND deleted = 0 AND folderID IS NOT NULL AND messageKey IS NOT NULL ORDER BY date DESC LIMIT 100;

This nets us:

0|0|TABLE messages WITH INDEX deleted
1|1|TABLE messagesText VIRTUAL TABLE INDEX 1:
0|0|TABLE messagesText VIRTUAL TABLE INDEX 2:

Everything’s an index!  We win!  Sorta.  The index it chose is somewhat worrying if you think about it.  But really, it’s all quite nebulous.  I have basically no idea what is happening in there.  The good news is that EXPLAIN will tell us the actual opcodes in use.  The bad news is that it is quite hard to understand (104 opcodes), at least for this query.

Python, graphviz, pygraphviz, and compulsive tool-building to the rescue!  My original plan was that data-flow analysis could make everything incredibly obvious as to what is going on.  I’m not sure I reached that point.  But in the process, the efforts required to make the system clever enough to do data analysis allow the control flow diagram to be quite pretty and have lots of useful information.  The main sign of data-flow analysis is that all cursor write operations have the list of cursors that data flowed from in parens.  Each cursor gets its own tango-ish color, and opcodes involving the cursor are colored by that cursor.

The major flaw in the data-flow analysis that springs to mind right now is that it ignores control flow.  An action that will only be taken because of a control-flow decision based on data retrieved from a cursor should ideally establish a relationship.  This is important because gloda throws around a lot of set intersections (although not in this case) in its queries, and it would be nice to be able to concisely express that.  The control-flow diagram is arguably orders of magnitude better than a raw EXPLAIN, but my hope is/was that the data analysis can make it trivial to figure out how things are being hooked up.  Given the amount of effort already expended and the present results, I figure I’m probably at the “control flow is good enough for the foreseeable future stage of things”.

In any event, the control-flow graph makes it (more) obvious that the outer loop is using the ‘deleted’ index to walk over *every deleted message in the database*.  A one-off idiom computes the full-text search and stashes it in an intermediary table.  As we then walk over every deleted message, we see if that message can be found in the full-text search result table.  If it is, our previously queued lazy-seek against the main messages table happens and we search against the full-text table to do our join.  And out pop results!

My hope for this query was that the deleted condition would be executed as a constraint as we were walking our result set, just like the folderID and messageKey constraints.  Making sure your queries are using the right index and helping the optimizer make the right call is a fairly textbook problem and the SQLite docs are actually pretty good on this.  For the sake of the example, I have dropped the index entirely.  (The ‘deleted’ index was added so we can quickly mark messages as needing deletion processing without slowing down deletes for the user.  It may turn out to be more beneficial to leave the field as-is, but use a separate table as our work queue.)

dataflow before

dataflow before

control-flow after

control-flow after

After the deletion, we get the revised diagram.  The full-text search still happens completely before we produce any other results, but this is keeping in keeping with our query.  (The query generation code is designed to handle the case where we have multiple constraints and must intersect the results of each.  It can clearly be optimized for the case where no primary-key intersection is required.)  The traversal of the full-text search result set is now the outer loop.  Deleted is now just filtering like folderID and messageKey, as expected.

The major lingering red flag is the block that calls Last() and Delete().  The conditional that makes the decision to do that is using “r1”, which is apparently implementing our limit logic inside the code.  This was confusing until I remembered that we’ve got an ORDER BY going on.  The Delete is just culling the results that will never potentially be seen.  The bad news is that we are doing our full-text search join prior to the ORDER BY culling.  So, my original fear that we are doing the JOIN no matter what still holds.  And that’s enough excitement for one day.

Given that any full-text search with ordered results will require retrieval the entire result set and correlating it against at least one table, I’m tempted to create separate tables for different windows of time given the importance of recency.  Thoughts/input appreciated, as anyone who has read this far is probably very detail oriented…

UPDATE (Feb 25, 2009): The hg repo is http://hg.mozilla.org/users/bugmail_asutherland.org/grokexplain/.  It now does some actual value propagation (and has had various bugs fixed).  By default it ignores ‘Yield’ because the way in which they are used (basically generator/continuation) wreaks havoc on the CFG with just straightforward static analysis.  If you want the yields, pass “yields” on the command line.  Also, passing “debug” gets you the states of the registers at the entrance/exit of the “basic blocks”.  (Not technically basic blocks, but close enough for my purposes.)

LogSploder, logsploding its way to your logs soon! also, logsplosion!

logsploder screenshot with gloda

In our last logging adventure, we hooked Log4Moz up to Chainsaw.  As great as Chainsaw is, it did not meet all of my needs, least of all easy redistribution.  So I present another project in a long line of fantastically named projects… LogSploder!

The general setup is this:

  • log4moz with a concept of “contexts”, a change in logging function argument expectations (think FireBug’s console.log), a JSON formatter that knows to send the contexts over the wire as JSON rather than stringifying them, plus our SocketAppender from the ChainSaw fun.  The JSONed messages representations get sent to…
  • LogSploder (a XULRunner app) listening on localhost.  It currently is context-centric, binning all log messages based on their context.  The contexts (and their state transitions) are tracked and visualized (using the still-quite-hacky visophyte-js).  Clicking on a context displays the list of log messages associated with that context and their timestamps.  We really should also display any other metadata hiding in the context, but we don’t.  (Although the visualization does grab stuff out of there for the dubious coloring choices.)

So, why, and what are we looking at?

When developing/using Thunderbird’s exciting new prototype message/contact/etc views, it became obvious that performance was not all that it could be.  As we all know, the proper way to optimize performance is to figure out what’s taking up the most time.  And the proper way to figure that out is to write a new tool from near-scratch.  We are interested in both comprehension of what is actually happening as well as a mechanism for performance tracking.

The screenshot above shows the result of issuing a gloda query with a constraint of one of my Inbox folders with a fulltext search for “gloda” *before any optimization*.  (We already have multiple optimizations in place!) The pinkish fill with greenish borders are our XBL result bindings, the blue-ish fill with more obviously blue borders are message streaming requests, and everything else (with a grey border and varying colors) is a gloda database query.  The white bar in the middle of the display is a XBL context I hovered over and clicked on.

The brighter colored vertical bars inside the rectangles are markers for state changes in the context.  The bright red markers are the most significant, they are state changes we logged before large blocks of code in the XBL that we presumed might be expensive.  And boy howdy, do they look expensive!  The first/top XBL bar (which ends up creating a whole bunch of other XBL bindings which result in lots of gloda queries) ties up the event thread for several seconds (from the red-bar to the end of the box).  The one I hovered over likewise ties things up from its red bar until the green bar several seconds later.

Now, I should point out that the heavy lifting of the database queries actually happens on a background thread, and without instrumentation of that mechanism, it’s hard for us to know when they are active or actually complete.  (We can only see the results when the main thread’s event queue is draining, and only remotely accurately when it’s not backlogged.)  But just from the visualization we can see that at the very least the first XBL dude is not being efficient with its queries.  The second expensive one (the hovered one) appears to chewing up processor cycles without much help from background processes.  (There is one recent gloda query, but we know it to be cheap.  The message stream requests may have some impact since mailnews’ IMAP code is multi-threaded, although they really only should be happening on the main thread (might not be, though!).  Since the query was against one folder, we know that there is no mailbox reparse happening.)

Er, so, I doubt anyone actually cares about what was inefficient, so I’ll stop now.  My point is mainly that even with the incredibly ugly visualization and what not, this tool is already quite useful.  It’s hard to tell that just from a screenshot, since a lot of the power is being able to click on a bar and see the log messages from that context.  There’s obviously a lot to do.  Probably one of the lower-hanging pieces of fruit is to display context causality and/or ownership.  Unfortunately this requires explicit state passing or use of a shared execution mechanism; the trick of using thread-locals that log4j gets to use for its nested diagnostic contexts is simply not an option for us.

Log4Moz and Chainsaw (via new XMLFormatter/SocketAppender)

Log4Moz, the premier mozilla-centric javascript logging framework has just gotten more… premier.

A picture of chainsaw with gloda

By hooking Log4Moz up to Chainsaw, Apache log4j’s pretty UI, we get a UI with some powerful features.  Namely, you can filter based on message text (using a regex even), level, source, etc.  Also, you can colorize the entries using the same expression mechanism.  In the screenshot below, you can see I have filtered to show only the messages with the word “noun” on them, and changed the background color of messages with “+++” in them.

Chainsaw! Gloda! Filters!

The enhancements made to Log4Moz are to provide an XMLFormatter that rolls in a similar fashion to log4j’s XMLLayout and a SocketAppender that never forgets… to kill!  And by kill, I mean establish TCP connections.

If you are a gloda user and upgraded to the version I told you to expressly not upgrade to, then you can use this new functionality by creating a file “/tmp/chainsaw.ptr” with the contents “localhost:4448”.  Run Chainsaw, create an XMLSocketReceiver, and Bob’s your uncle.  Unfortunately, Bob is not your uncle when it comes to building chainsaw.  While maven no longer entirely angries up my blood, the process still leaves something to be desired.  (Using this ~/.m2/settings.xml with “-P default” may take fewer years off your life if you take this path.)

These enhancements are currently in the gloda repository, and perhaps will make their way back upstream or what not?  (Land them quick, before I add all forms of crazy helpers like JSON-ing extra arguments and sending them across the wire too!)

UPDATE: Of course, it’s always a good idea to pull from the tip, as the revision linked above had a bit of foolishness with timeouts.

chroniquery does useful things!

Before pecobro, there was chroniquery (shiny, also shiny, texty), a python binding for roc‘s chronicle-recorder omega-debugger.  Now, there is still chroniquery.  It just does more stuff, and does the stuff it previously did more correctly.

In any event, what the awesome ‘screenshot’ (it’s from a console…) shows:

  • A trace from running chronicle-recorder against xpcshell on amd64 running a gloda unit test.
  • Javascript being ‘traced’ with extraction of the function name, script, and line number… everything you’d expect from your dtrace probes or your JSD hooks/venkman/firebug…
  • Hm… it seems to know something about an XPConnect call going down…
  • Oh noes!  It has escaped into the C++ codes!

pecobro, the tell-you-who-reads/writes-what performance code browser

No cool pictures, but I’ve enhanced and exposed the global reader/writer understanding of javascript code.  In other words, pecobro now does a passable job at telling you what global variables a given javascript file reads from/writes to, and who else writes to/reads from those variables.  False negatives are expected (don’t rely on things to be exhaustive), and false positives are quite conceivable.

As an example starting point, take a look at messageWindow.js’s global reads or global writes.  From either of these you can click on other files in the sidebar to go to them.  There is no execution trace, so the overview diagram won’t be any help.  Be sure you have some free memory available and won’t try and hurt me if Firefox does something crazy.  Note: for long documents, some delay is expected as it attempts to apply various fix-ups.  Also note: clicking on things in the global reads/global writes tab won’t get you anywhere for now.

A quick example of a global read from that file (and who writes to that global):

gDBView

  • Top Level: commandglue.js
  • Function: ClearThreadPane (in commandglue.js)
  • Function: CreateBareDBView (in commandglue.js)
  • Function: RerootFolder (in commandglue.js)
  • Function: SwitchView (in commandglue.js)
  • Function: openFolderTab (in mailWindowOverlay.js)
  • Function: setMailTabState (in mailWindowOverlay.js)
  • Function: restorePreSearchView (in searchBar.js)
  • Function: MsgGroupBySort (in threadPane.js)

A quick example of a global write from that file (and who reads from that global):

SelectFolder

  • Function: OpenMessageByHeader (in mailContextMenus.js)
  • Function: OpenInboxForServer (in mailWindow.js)
  • Function: selectFolder (in mailWindow.js)
  • Function: openFolderTab (in mailWindowOverlay.js)
  • Function: LoadNavigatedToMessage (in messageWindow.js)
  • Function: LoadNavigatedToMessage (in msgMail3PaneWindow.js)
  • Function: OnLocationTreeSelect (in msgMail3PaneWindow.js)
  • Function: SelectServer (in msgMail3PaneWindow.js)
  • Function: loadStartFolder (in msgMail3PaneWindow.js)
  • Function: RenameFolder (in widgetglue.js)
  • Function: loadInboxForNewAccount (in accountUtils.js)
  • Function: DropOnFolderTree (in messengerdnd.js)
  • Function: CrossFolderNavigation (in msgViewNavigation.js)

The code, as always, is available at http://hg.mozilla.org/users/bugmail_asutherland.org/pecobro/

master control pecobro, the overkill performance code browser

The title isn’t true yet, but it’s disturbingly almost-true.  Pecobro’s hackish underpinnings have been “accidentally” replaced with surprisingly forward-looking code capable of supporting a much fancier feature set.  (I didn’t mean to, but I got tricked because the incremental cost to doing the ‘right thing’ was always so low.)

The trace that you can see here, by clicking on any of this text what has coloring (and using firefox 3 in a session that you don’t mind if it crashes), is of running Mark Banner (Standard8)‘s Thunderbird bloatTest on OS X with DTrace probes enabled, but without actually doing the bloat testing.  So Thunderbird starts up, opens the address book, closes it, opens the compose window, closes it, and then quits.

Here is a preliminary processed trace from a run triggering bug 296453.  Be forewarned that there is some missing information from the underlying trace and so it’s not all that it could be.  I think the XPConnect probes need to be fleshed out slightly more (and processed).

The code (both pecobro and mozilla codebase patches) is at: http://hg.mozilla.org/users/bugmail_asutherland.org/

What crazy overkill things can pecobro do now?

  • Parse all of the javascript code used in Thunderbird, including nearly all (maybe all?) of the 1.x enhancements.  The parser is still a bit hackish, especially when it comes to support of regexes, but it actually parses things.  Thanks to Chris Lambrou for posting his initial JavaScript.g antlr3 grammar (and BSD licensing it) that I used as a basis for my hacky version.  This was certainly a learning experience; I now know that javascript can never replace python in my heart…
  • Find all of the places functions can be defines in javascript code and do a pretty good job at figuring out reasonable names for them.  This even includes “(new)? Function()”.  This allows us to use the function-info DTrace probes to use line number information to identify functions.  We do this so that we can identify anonymous functions.
  • Handle XBL as well as we handle pure-javascript files.  (Parsing/AST fix-ups/syntax highlighting with AST traversal/etc.)
  • Parse/interpret disturbingly large portions of makefiles.  Sure, it ignores the rules, and I’ve only implemented the functions I require, but it does all the conditional and include stuff with variable expansion, including some key functions like foreach/filter/etc.
  • Parse jar manifests sufficiently well to figure out what file ends up at what chrome path.
  • Cache its javascript parse results at both the AST and (sorta-semantic) processing level, among other things.  Hooray for cerealizer which dares persist/de-persist that which pickle dare not.  (Nested classes.)  (Note: We don’t cache XBL stuff yet, and the ASTs are large enough that de-persisting them can be quite perceptible.)

What is not crazy, but still nice:

  • The traces are now much more reliable thanks to modifications to the Mozilla USDT probes to provide sufficient information for us to distinguish between JavaScript execution contexts (namely, JSContext).  Modifications were also made to avoid the ‘guessing’/ghost value problems that happen when native functions were called.
  • A foolish bug in the sparkbar calculation has been fixed.  aka “Now With Accuracy”!
  • If a function in a trace called another function or was called by another function, this will be displayed inline in the source display.
  • Infer ‘native’ functions (with the above additional modifications to the Mozilla USDT probes), assigning them to an object.  This ends up being Object, ChromeWindow, or other native Class type.  Some of this may be mooted by getting the XPConnect probes reliably in the mix.

What doesn’t it do?

  • Add the XPConnect js_Invoke probes; I punted on that because that was turning out to be difficult to get right.
  • It ignores .xul files for now.  Although xul files primarily appears in a caller context (as told by function-info probes), they can also be a callee when someone pulls a fast one and inlines some simple code in a script tag.  We brutally mis-attribute the call to the previous function when this happens.  This will eventually get resolved because we will need to understand .xul files for namespace reasons.  Also, people sound like they’re interested in who overlays what and the like, and that’s sorta right up our alley thanks to all the overkill stuff we do.
  • Exhaustively determine reads from/contributions to the ‘global’ (window or what not) namespace/scope.  The groundwork is there in terms of understanding the contribution of top-level statements to the namespace or its reads from it, but we don’t traverse into functions.
  • Associate functions with an object/type (ignoring the native function case).  This requires more semantic understanding.
  • Clicking on functions still doesn’t do anything.  I disabled that before my first post on pecobro due to firefox-crashing issues, and still haven’t gotten around to resolving it.
  • A usable overview visualization.  The overview diagram has become cluttered by the presence of so many ‘relevant’ (touched) files.

chronicle-recorder and amd64, hooray!

overview: visichron.py trace python -f main -d 3

My personal laptop rolls amd64-style (rather than i686), and chronicle-recorder’s valgrind component was not working on it (“illegal instruction”). I have done some vendor-branch dancing to get chronicle-recorder’s valgrind sub-directory to use valgrind 3.3.0. A bzr branch of just the valgrind subdirectory (drop-in or build separately and make sure you invoke valgrind from that location) is available here: http://www.visophyte.org/rev_control/bzr/valgrind-chronicle/valgrind-chronicle/

A probably faster location to bzr branch from is here: http://clicky.visophyte.org/rev_control/bzr/valgrind-chronicle/valgrind-chronicle/

and a tarball of the tip is here: http://www.visophyte.org/rev_control/tarballs/valgrind-chronicle-r6.tar.bz2

I have also updated chroniquery (my python binding for chronicle-query’s JSON interface, and its own set of tools that build on it) to work with amd64. Its bzr branch is here: http://www.visophyte.org/rev_control/bzr/chroniquery/trunk/

The goal of all of this was to be able to run chronicle against Thunderbird, which I was able to do. Unfortunately, visichron (the visualizing part of chroniquery using visophyte) is not quite ready for such an undertaking at this time.  (Not to mention a few C++ symbols issues…)

snippet: visichron.py trace python -f main -d 3

However, it was powerful enough to handle visualizing the trace resulting from invoking python on a python file with just “print ‘hello world'” in it. So that’s what you see here, albeit limited to only 3 call levels deep. Click on the upper picture to see the whole thing at 2000×2000, or just look on the lower picture to get an idea of what’s going on. Just like my first post using visichron, the rings are colored based on a (naive) control-flow-taken basis. The ring colors are per-function, however. Also, the node colors are ‘hot’ colored based on how many ‘ticks’ were spent inside the functions, multiple counting for recursion.

Other interesting changes include some primitive watch functionality for chronisole’s ‘trace’ mode. Also, the previously unmentioned readchron.py now understands and prints BunchedEffect and RegEffect info. (readchron aspires to be along the lines of readelf for chronicle databases, but with more colors.)