Chronicle-Recorder Graph/Ring Visualization! Hooray!

Thanks to new and improved time management skills (and a holiday weekend doesn’t hurt), I’ve got a chronicle-recorder visualization going on via chroniquery:
visichron.py trace vfancy -f smain

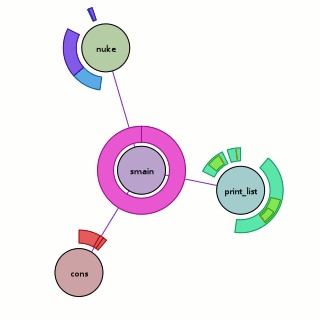
Above, we have the visualization run against the ‘fancy’ program seen in the previous chroniquery posts (with one caveat, addressed later). What does it mean?

  • The circular nodes are functions in the executed program. In this case, we start from ‘smain’ and pull in all the subroutines that we detect.
  • The edges between nodes indicate that a function call occurred between the two functions sometime during the execution; it could be once, it could be many times. The color of the edge is a slightly more saturated version of the color of the node that performed the call. If they call each other, only one color wins.
  • The rings around the outside of each node indicate when it was called, specifically:
    • The ring starts and stops based on the chronicle-query timestamp. Like on a clock, time starts at due north and flows around clock-wise, with the last smidge of time just before we reach due north again.  This has its ups and downs. The reason we are using ‘smain’ instead of ‘main’ is that when we used the untouched main, the first “new” ended up taking up most of our timestamp space. So I turned main into smain and had a new main that takes the memory allocator start-up cost hit and then calls smain.
    • The thickness of the ring indicates the depth of the call-stack at the time. The thickest ring corresponds to the outermost function, the thinnest ring to the innermost function. This results in a nice nesting effect for recursive functions, even if it’s more of an ‘indirect’ recursion.
    • The color of each ring slice is based on the control flow taken during the function call. (I think this is awesome, hence the bolding.) Now, I’m making it sound fancier than it is; as a hackish first pass, we simply determine the coverage of all the instructions executed during that function call. A more clever implementation might do something when iteration is detected. A better implementation would probably move the analysis into the chronicle-query core where information on the basic blocks under execution should be available. Specific examples you can look at above:
      • print_list: The outermost calls are aqua-green because their boolean arguments are true. The ‘middle’ calls are light green because their boolean arguments are false. The fina, innermost calls are orange-ish because they are the terminal case of the linked-list traversal where we realize we have a NULL pointer and should bail without calling printf. They are also really tiny because no printf means basically no timestamps for the function.
      • nuke: Four calls are made to nuke; the first and third times (light blue) we are asking to remove something that is not there, the second and fourth times (purple) we are asking to remove something that is. I have no idea why the third removal is so tiny; either I have a bug somewhere or using the timestamps is far more foolish than I thought.

Besides the obvious shout-out to chronicle-recorder, pygraphviz and graphviz power the graph layout. Now, a good question would be whether this actually works on something more complex? Could it be? Well, you can probably see the next picture as you’re reading this, so we’ll cut this rhetorical parade short.
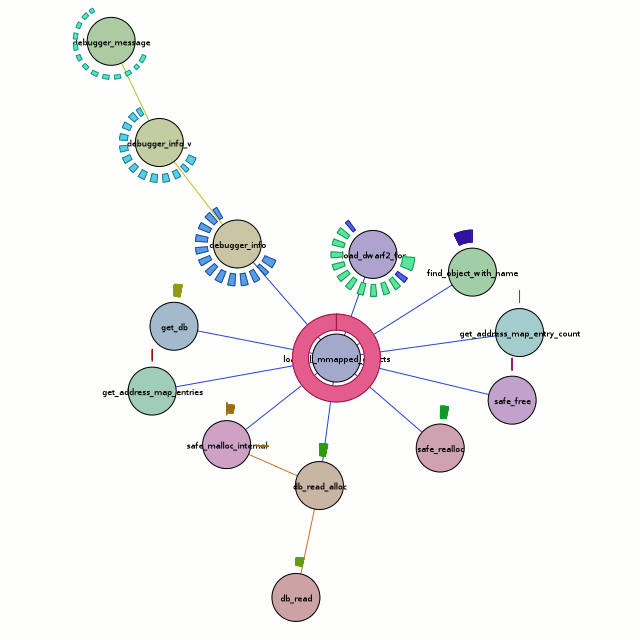
visichron.py trace chronicle-query -f load_all_mmapped_objects

Besides the obvious font issues, this actually looks pretty nice. But what does it tell us? Honestly, the full traversal here is excessive. All we care about is the center node, load_all_mmapped_objects, and load_dwarf2_for (due north and a teeny bit east of the center node). If we look at the calls to load_dwarf2_for, we can see that two of them have different control-flow coverages. Those happen to be the times debug symbols could not be found (which is my problem I want to debug). The first one is for ld-2.6.1.so (I’m looking at the textual output of chronisole for the same command), and the second one is for /usr/bin/python2.5. The second one should definitely not fail, because it should find the symbols in /usr/lib/debug, but it does.

Unfortunately, the trail sorta stops cold there with a bug in either chronicle-query or in chroniquery (possibly cribbed from chronomancer). load_dwarf2_for should be calling dwarf2_load, but we don’t see it. I don’t know why, but I haven’t actually looked into it either. Rest assured that a much more awesome graph awaits me in the future!

Because there’s too much text and not enough pictures, I’ll also throw in the output of the ring visualization test which uses a stepped tick-count (1 per function call) to show how things could look if we went with an artificial time base…
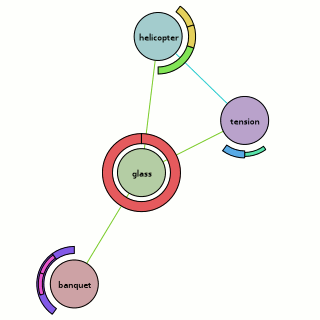
ring visualization example

Bzr repositories for both can be found at http://www.visophyte.org/rev_control/bzr/.

Hooray for dwarf location lists!

chronisole-trace-fancy-main-working.png

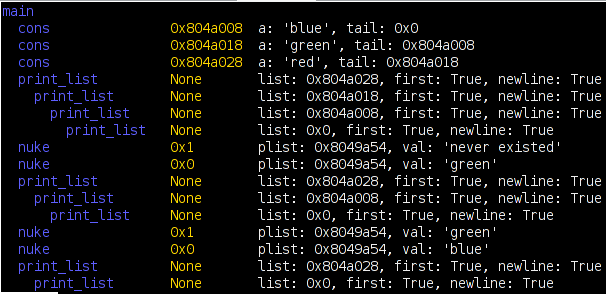
I resolved the time-stamp issues from last time. Arguments are now happy because we move to the time-stamp corresponding to when the function’s prologue had completed. The booleans were wrong because they were copied to locals during the prologue, which is where the argument list referenced them. Things like this are much easier to diagnose thanks to support of disassembly prints-outs via the diStorm64 disassembler, although I may move to using libdisassemble in the future since it is pure python and presumably provides (or can be more easily coerced to provide) a richer set of info about the disassembly.

Chroniquery slightly more chronoriffic

So, I was playing with the fantastic Chronomancer (roc‘s announcement, project link), an Eclipse GUI for chronicle-recorder, using a trace from my PyXPCOM troubles. I discovered a lack of some symbols that seemed like they should be there and decided to then run chronicle against chronicle-query and view the problem in Chronomancer so that I might smite it. Unfortunately, some stuff didn’t show up in that trace, so I went investigating by way of enhancing chroniquery so that I might better understand the problem while also making chroniquery more usable. Sadly, there’s still more work to be done, but I have a picture to show and I understand a good deal of the chronomancer internals now and how to drive chronicle-query better.

chroniquery against fancy, tracing main, minor issues

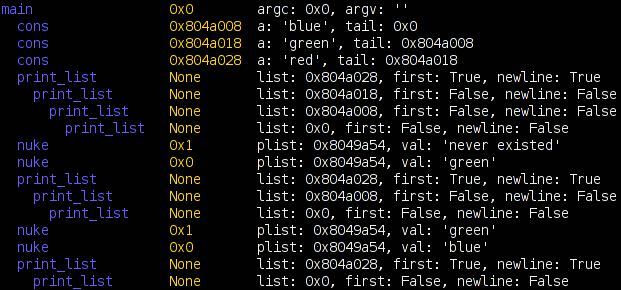
The above is pretty representative of what chroniquery’s chronisole can now do. It’s an invocation of chronisole.py trace fancy -f main. The ‘fancy’ program builds a linked list using ‘cons’, uses the recursive ‘print_list’ to print the list, and uses the iterative ‘nuke’ to delete entries from the list. ‘cons’ returns the newly allocated list entry/cons cell, and nuke returns 0 if the entry existed and was nuked or 1 if it didn’t exist. We traced main because of the -f; we could start with any bunch of functions as the root, and can use -x to filter out noisy functions from the recursive function discovery. Return values and parameters are shown.

Of course, even in this example, the first/newline booleans are wrong, presumably indicative of some wackiness/off-by-one-error in my mechanism for determining the sub-called functions’ function entry timestamps. I’m confident I’m doing some foolish things, but it will have to wait until the weekend and a more well-rested brain. I’ve pushed the changes to the bzr tree if anyone wants to do my work for me.

Chroniquery: Chronicle-Recorder and Python Boogie Down

Robert O’Callahan‘s Chronicle-Recorder is one of the most exciting debugging tools to come down the road ever. In order to help me track down my PyXPCOM problem that has been a stumbling block to full Thunderbird integration, I’ve laid the groundwork for a nice Python-based interface to chronicle-query.

chronisole output on loopy

You can find it in a bzr repository at http://www.visophyte.org/rev_control/bzr/chroniquery/

It depends on some mods I’ve made to chronicle-recorder which can either be found in my (st)git repository (git-svnimport’ed) at http://www.visophyte.org/rev_control/git/chronicle-recorder.git/ on the acs-base branch. I have no idea how to have someone branch the repository and get stgit to actually understand the patches, so I have also exported the patches to http://www.visophyte.org/rev_control/patches/chronicle-recorder/. They should apply cleanly to rev 13/15 of the trunk. In a nutshell, the patches make things work with a somewhat-up-to-date Ubuntu gutsy (7.10) install, add the ability to retrieve information on compilation units including their memory offsets, add the ability to get source line information (with some overkill on determining the end of the current ‘line’), and a bugfix for negative line offsets.

It’s my understanding from roc’s blog that he’s been working on a proper debugger interface, so some of these patches may be redundant or otherwise rendered moot.

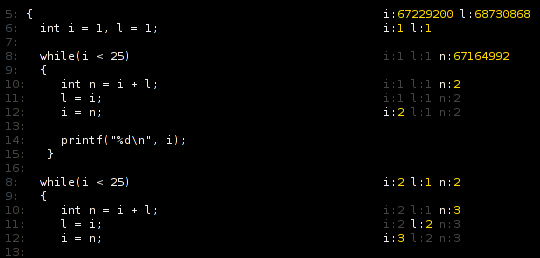
The picture above is a screenshot of Firefox rendering the styled HTML output of chronisole.py run against the loopy.c program in the chroniquery examples dir. (Click on the picture to go to the HTML.) It’s like a fibonacci generator, but it’s not. If you run chronisole in a terminal without the HTML args, it will output the equivalent, but you need to have a 256-color xterm. To summarize its actions, it finds all the compilation units residing in the executable which have low_pc/high_pc info and uses that as the basis of the ranges of interest for an instruction scan. It loops over the source-lines as they are executed in sequence, grabs the lines, and looks up the values of the locals just after the source line completes execution. If each local’s value differs or was not in the previously executed line’s locals, it gets to be yellow, otherwise it is a subtle color.

the beginnings of a gdb execution trace visualization

GDB execution trace vis 1

Python code driving gdb via the mi2 interface (using pexpect and pyparsing) begets a trace file. Python code processing the trace file begets an html document (with syntax highlighting thanks to pygments.) The above is just a screenshot of the output, which you can actually browse here.

The “visualization” is pretty simple. Lines of code with a light green background were executed in the trace. 15 lines of context are shown around executed lines of code. The bars to the left show when the line of code was executed during the trace. If the code was a function call, its bar is extended until the function call completed based on conclusions drawn from knowing the stack depth at each step. There is currently no way to visually distinguish from the graphic between a line executed many times in rapid succession and a call that lasted a long time. You would need to either look at the code or cheat and use firebug.

The visualization is of a call to commit() using pysqlite2 on sqlite3 which fails because of an outstanding select that has not yet had all its rows retrieved. My conclusion is that clever generator tricks (not mine!) can bite you when any piece of your stack has concurrency issues… and pysqlite2 should report the most specific error string possible. (Going to provide a patch; still think the trunk would provide the rather generic error that bit me.) For those using trac’s version control abstraction, be warned that changeset traversal is most definitely a (logic) generator wrapping a row-results-fetching generator.

GDB execution trace vis 2

The tracing mechanism is pretty straight-forward. The tracing class is told an interesting breakpoint and an ignore count. Once the count has been reached, “step” tracing begins. The idea was to do a first pass that just counts how many times the interesting breakpoint occurs before the program tanks, then we can skip to the last few before doing the (slow) step-wise tracing in the second pass. The goal would be to approximate a light-weight tracing mechanism where we can see what the program did before whatever bad state occurred. Gah! I was just going to say that there aren’t any open source tools readily available to accomplish that goal (dyninst/dpcl still require a bit of legwork), but it turns out that Chronicle (formerly Amber) has recently been released. (For whatever reason, Robert O’Callahan’s post didn’t show up in his feed via planet mozilla for me.) OTOH, this method is still potentially useful for remote gdb target debugging on actual hardware (albeit extremely slowly), or perhaps for a case where the program must do a lot of execution before the interesting part of the trace happens, lending itself to a non-valgrind solution. I presume you would pay the simulation price for valgrind the whole way through, unless valgrind can ‘absorb’ a running process into its simulation.

I also have a visualization done using visophyte’s model abstraction (if you are going to go and invent yet another multi-backend canvas abstraction layer, you might as well use it), but without some way to view the corresponding code and explore, it is useless. The generated HTML here is more useful, but still lacking in interactivity or true context. That would be the next step. The step after that would be throwing back in a concise and interactive visualization. The same effort required for that should allow me to produce interactive visualizations from thunderbird.