using review board for bugzilla request queues / reviews

review-board-dashboard

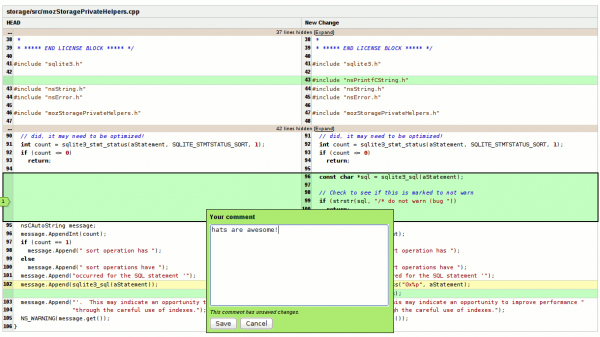
Review board is a delightful django-based review tool.  Whereas bugzilla’s diff display is limited to taking the provided diff and coloring hunks without additional context, review board actually retrieves the underlying files from mercurial, applies the patch, colorizes the source files (using pygments), and thus can give you additional context.  Also, it allows you to click on line(s) and attach a note at that location.

Anywho, I made a new tool that ‘synchronizes’ bugzilla request queues with review board.  It finds the things in your request queue, and then creates a review in review board, transferring the patch.  There is some limited hard-coded biasing towards comm-central, but it’s arguably easily adaptable.  It uses a slightly hacked up version of the post-review script found in review board’s contrib directory to serve as the API to review board.

review-board-diffy-comment

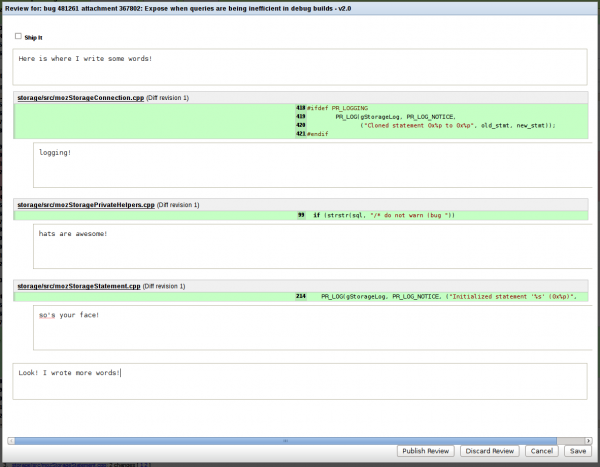
The intent is to make it easier for people, or at least me, to do reviews.  I am definitely NOT proposing that the review “of record” live outside bugzilla.  But I think it might make it easier to prepare reviews in the first place.  For example, see the picture below?  It’s the result of my clicking on lines of code and making notes.  And those hyperlink-looking things that look like they might take you to the actual context, rather than manually having to try and determine context from people’s comments in the bugzilla notes?  They are actual hyperlinks that do what I just said!

review-board-review

If you are a mailnews hacker and would like to see your review queue in my reviewboard instance, ping me on IRC.  I may have already processed your queue and made you an account, or maybe not.  The review board API does not yet automate user creation and I got tired of doing things manually and gave up.

Warnings:

  • Things go awry on old-school patches.  For example, a patch that thinks it is against (the CVS layout of) “mozilla/mailnews” appears to not work.  The right answer is a patch against “a/mailnews” (I’m not sure if the git-style is essential).  Things worked fine for my queue, but some people with old stuff in their queues experienced glitches.  The script now inserts “problem!” into the summary when this happens, but in my reviewboard instance there may be some reviews that pre-date this logic.  (There should be a note in the description though.  Also, there will obviously be no diff attached.)
  • I initially forgot about the whole review=one person, super-review=another person, and maybe review=yet another person.  Although this is now fixed and reviews target all requested revieweres, there may be some reviews missing from your queue because they were created for one of the dudes who was not you and my manual nuking didn’t get to those.
  • Uh, it creates the reviews, but it doesn’t destroy them.
  • Also uh, there will be scaling issues if the reviews don’t eventually get closed out.

understanding libmime using chroniquery and unit tests

chroniquery-trace-failed-return-value

Mailnews’ libmime is one of the harder modules to wrap one’s head around.  8-letter filenames where the first four letters tend to be “mime”, home-grown glib-style OO rather than actual C++, and intermingling of display logic with parsing logic do not make for a fun development or even comprehension experience.

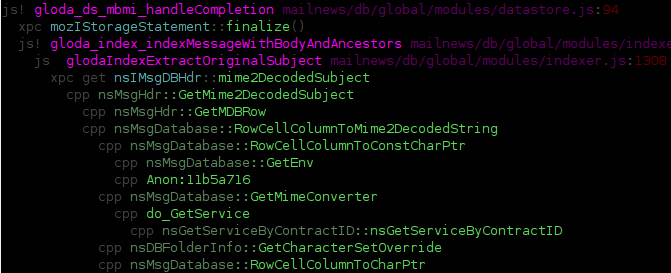
Running an xpcshell unit test run under roc‘s chronicle-recorder and then processing it with my chroniquery stuff (repo info), we get a colorful HTML trace of the execution somewhat broken out (note: pretend the stream_write/stream_completes are interleaved; they are paired).  Specific examples of libmime processing for the inquisitive (there are more if you check the former link though):

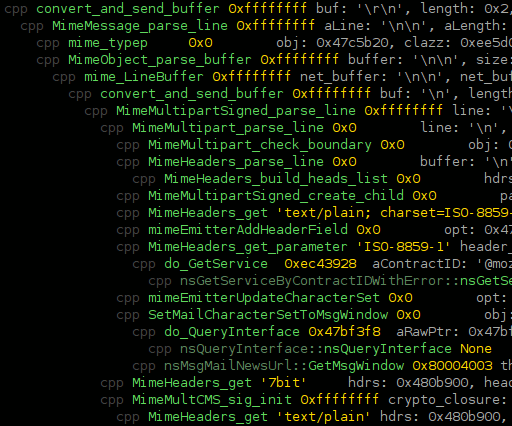
The thing that kickstarted this exciting foray is the error pictured in the screenshot above from an earlier run.  The return values are in yellow, and you can see where the error propagates from (the -1 cast to unsigned).  If you look at the HTML file, you will also note that the file stops after the error because the functions bail out as soon as they hit an error.

However, our actual problem and driving reason for the unit tests is the JS emitter choking on multipart/related in writeBody (which it receives by way of ‘output_fn’).  Why?  Why JS Emitter?!  (You can open the links and control-F along at home!)

  • We look at the stream_write trace for our multipart/related.  That’s odd, no ‘output_fn’ in there.

chroniquery-stream_complete-output_fn

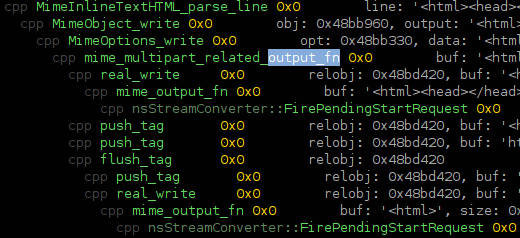
  • We look at the stream_complete trace for the multipart/related.  There’s our ‘output_fn’!  And it’s got some weird HTML processing friends happening.  That must be to transform links to the related content into something our docshell can render.  This also explains why this processing is happening in stream_complete rather than stream_write… it must have buffered up the content so it could make sure it had seen all the ‘related’ documents and their Content-IDs so it could know how to transform the links.
  • Uh oh… that deferred processing might be doing something bad, since our consumer receives a stream of events.  We had to do something special for SMIME for just such a reason…
  • We check stream_complete for ‘mimeEmitterAddHeaderField’ calls, which the JS emitter keys off of to know what part is currently being processed and what type of body (if any) it should expect to receive.  Uh-oh, none in here.

chroniquery-stream_write-addheaderfield

  • We check stream_write for ‘mimeEmitterAddHeaderField’ calls, specifically with a “Content-Type” field.  And we find them.  The bad news is that they are apparently emitted as the initial streaming happens.  So we see the content-type for our “text/html”, then our “image/png”.  So when stream_complete happens, the last thing our JS emitter will have seen is “image/png” and it will not be expecting a body write.  (It will think that the text/html had no content whatsoever.)
  • Khaaaaaaaaaaaaaaaaaaaaaaaaan!

In summary, unit tests and execution tracing working together with pretty colors have helped us track down an annoying problem without going insane.  (libmime is a lot to hold in your head if you don’t hack on it every day.  also, straight debugger breakpoint fun generally also requires you to try and formulate and hold a complex mental model… and that’s assuming you don’t go insane from manually stepping aboot and/or are lucky with your choices of where you put your breakpoints.)  The more important thing is that next time I want to refresh my understanding of what libmime is up to, I have traces already available.  (And the mechanics to generate new ones easily.  But not particularly quickly.  chronicle and my trace-generating mechanism be mad slow, yo.  It may be much faster in the future to use the hopefully-arriving-soon archer-gdb python-driven inferior support, even if it can’t be as clever about function-call detection without cramming int 0x3’s all over the place.)

Useful files for anyone trying to duplicate my efforts: my ~/.chroniquery.cfg for this run, the unit test as it existed, and the command-line args were: trace -f mime_display_stream_write -f mime_display_stream_complete -c -H /tmp/trace3/trace.html –file-per-func-invoc

dxrpy with references against mailnews, plus bespin wishes

dxrpy-nsimsgfolder-delete

bsmedberg‘s dxrpy likes to generate documentation using dehydra (bsmedberg’s blog posts on this: 1 2).  I have added support for references/referencedBy extraction and otherwise wailed on it a little bit, and run this against JUST comm-central’s mailnews/ directory.  The collection process is still strictly serial, and there’s a lot of stuff in mozilla-central/comm-central, which is why the subset.  You can find the outputs here.  My repository with my changes is here.  There are all kinds of issues and limitations, of course.

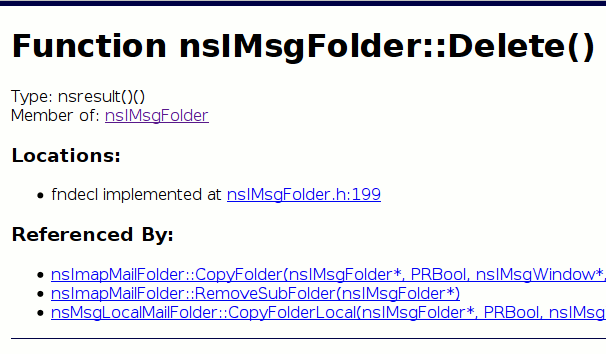
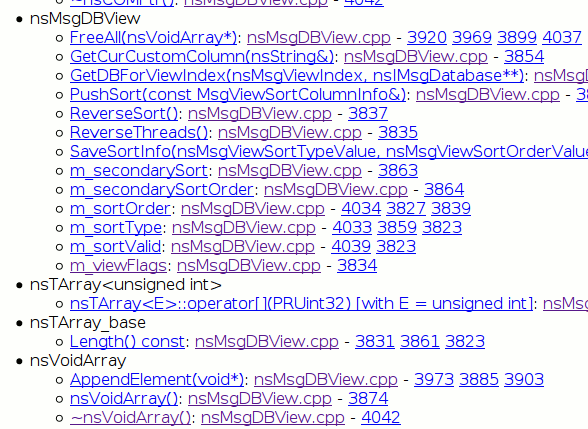
The picture above is of nsIMsgFolder::Delete(), the major advantage over mxr being that we’re not going to have ambiguity from completely unrelated Delete methods.  Note that in the mxr link I am cheating by not filtering to mailnews/, but the point is that with dxrpy you don’t need to do that.  The picture below shows a slice of the ‘references’ information for nsMsgDBView::Sort.  Another thing you could see is who is using nsVoidArray (in mailnews/!) by virtue of referencing its destructor.

dxrpy-nsmsgdbview-sort-references

My interest in this is a continuation of my efforts on pecobro to provide an interface to expose performance information from various means of instrumentation.  That such a thing requires a useful interface substrate is just a nice surprise.  The dehydra C++ stuff complements the references/referenced by work I did for javascript in pecobro.  Eventually I would hope to use the jshydra infrastructure to accomplish the js stuff since the parser pecobro uses is an unholy/brittle thing, and a usable jshydra would have all kinds of other exciting uses.

Things I would be very happy for other people to magically do so I don’t need to do them:

  • Magic up bespin so that it can pull files out of hg.mozilla.org.  One of the significant reasons I did not do more work on pecobro is that the approach of syntax highlighting in DOM explodes quite badly when confronted with source files you might find in mozilla-central/comm-central.
  • Make dxrpy generate json files representing the information it knows about each source file (positions => semantic info) as well as each function (positions in a function of references=> semantic info on those references).
  • Make bespin retrieve those json files when the file is loaded so that its naive syntax highlighting can be augmented to correlate with that semantic info.  One could attempt to be clever and use simple regexes or something to allow this information to be maintained while you edit the file, but I only need bespin to be read-only.
  • Make it easy for bespin to use that info to follow references and return without sucking.
  • Make something that extracts stack-traces from socorro and clusters this information by class, sticking it in static json files too, why not.
  • Make bespin use its semantic and just general line number info to grab the stack-trace crash info so that it can highlight code in bespin that is suspected to be crashy.  (You would probably want to get clever about determining what is a potentially innocent frame in the trace and what should be considered actually crasy.  Knowing when you’re calling out of your module is probably a simple and useful heuristic.)
  • Make something that chews the crash stacks with the dehydra/dxrpy data to make a visualization of where the crasy stuff is happening, module-wise.)
  • Make bespin retrieve json files of file/class-oriented json files that my performance tooling generates, letting me display cool sparkline/sparkbar things in the source.
  • Cleanup/infrastructurization of dxrpy’s generation/display mechanisms.  My greatest need of dxrpy is actually a coherent framework that can easily integrate with bespin.  The tricky part for my performance work is the javascript side of the equation, and the pecobro tooling actually does pretty well there.  It just wants to have a migration path and an interface that doesn’t cause firefox to lock up every time I change syntax-highlighted documents…

And if anyone already has a tool that is basically a statistical profiler that can do stack-traces that fully understand the interleaved nature of the C++ and spidermonkey JS stacks, that would be great.  (Bonus points for working with the JIT enabled!)  My dream would be a timer-driven VProbe based solution; then I could run things against a replay and avoid distortion of the timescale while also allowing for a realistic user experience in generating the trace.  I would like to avoid having to do trace reconstruction as I have done most recently with dtrace and chronicle-recorder.  I would not be opposed to a PythonGDB solution, especially if VMware 6.5 still provides a gdb remote thinger (did the eclipse UI make that disappear?), although that would probably still be more crossings than I would like and perhaps slower (if less distorting) than an in-process or ptrace based solution.

LogSploder, logsploding its way to your logs soon! also, logsplosion!

logsploder screenshot with gloda

In our last logging adventure, we hooked Log4Moz up to Chainsaw.  As great as Chainsaw is, it did not meet all of my needs, least of all easy redistribution.  So I present another project in a long line of fantastically named projects… LogSploder!

The general setup is this:

  • log4moz with a concept of “contexts”, a change in logging function argument expectations (think FireBug’s console.log), a JSON formatter that knows to send the contexts over the wire as JSON rather than stringifying them, plus our SocketAppender from the ChainSaw fun.  The JSONed messages representations get sent to…
  • LogSploder (a XULRunner app) listening on localhost.  It currently is context-centric, binning all log messages based on their context.  The contexts (and their state transitions) are tracked and visualized (using the still-quite-hacky visophyte-js).  Clicking on a context displays the list of log messages associated with that context and their timestamps.  We really should also display any other metadata hiding in the context, but we don’t.  (Although the visualization does grab stuff out of there for the dubious coloring choices.)

So, why, and what are we looking at?

When developing/using Thunderbird’s exciting new prototype message/contact/etc views, it became obvious that performance was not all that it could be.  As we all know, the proper way to optimize performance is to figure out what’s taking up the most time.  And the proper way to figure that out is to write a new tool from near-scratch.  We are interested in both comprehension of what is actually happening as well as a mechanism for performance tracking.

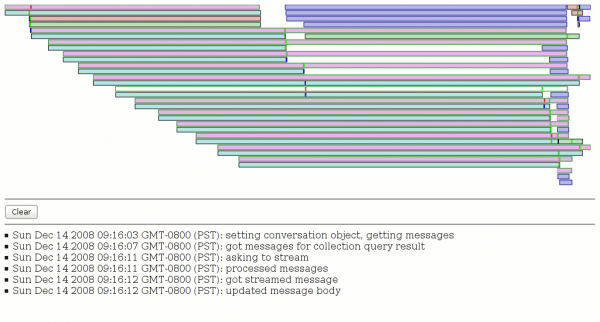
The screenshot above shows the result of issuing a gloda query with a constraint of one of my Inbox folders with a fulltext search for “gloda” *before any optimization*.  (We already have multiple optimizations in place!) The pinkish fill with greenish borders are our XBL result bindings, the blue-ish fill with more obviously blue borders are message streaming requests, and everything else (with a grey border and varying colors) is a gloda database query.  The white bar in the middle of the display is a XBL context I hovered over and clicked on.

The brighter colored vertical bars inside the rectangles are markers for state changes in the context.  The bright red markers are the most significant, they are state changes we logged before large blocks of code in the XBL that we presumed might be expensive.  And boy howdy, do they look expensive!  The first/top XBL bar (which ends up creating a whole bunch of other XBL bindings which result in lots of gloda queries) ties up the event thread for several seconds (from the red-bar to the end of the box).  The one I hovered over likewise ties things up from its red bar until the green bar several seconds later.

Now, I should point out that the heavy lifting of the database queries actually happens on a background thread, and without instrumentation of that mechanism, it’s hard for us to know when they are active or actually complete.  (We can only see the results when the main thread’s event queue is draining, and only remotely accurately when it’s not backlogged.)  But just from the visualization we can see that at the very least the first XBL dude is not being efficient with its queries.  The second expensive one (the hovered one) appears to chewing up processor cycles without much help from background processes.  (There is one recent gloda query, but we know it to be cheap.  The message stream requests may have some impact since mailnews’ IMAP code is multi-threaded, although they really only should be happening on the main thread (might not be, though!).  Since the query was against one folder, we know that there is no mailbox reparse happening.)

Er, so, I doubt anyone actually cares about what was inefficient, so I’ll stop now.  My point is mainly that even with the incredibly ugly visualization and what not, this tool is already quite useful.  It’s hard to tell that just from a screenshot, since a lot of the power is being able to click on a bar and see the log messages from that context.  There’s obviously a lot to do.  Probably one of the lower-hanging pieces of fruit is to display context causality and/or ownership.  Unfortunately this requires explicit state passing or use of a shared execution mechanism; the trick of using thread-locals that log4j gets to use for its nested diagnostic contexts is simply not an option for us.

Thunderbird and gloda go to meme-town

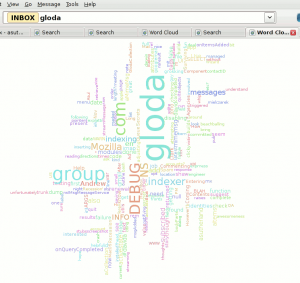
Sure, a word cloud of your blog posts is cool… but what if you could take any search of your e-mail, and turn that into a word cloud?  And then, if you click on one of those words, your search constraints would be revised to use the word you clicked on (and you’d get a useful search result, not another word cloud)?  And what if that layout algorithm were not as good as wordle?  The future is now, people!  (At least if you install like 5 extra extensions out of mercurial.)

The screenshot above is from Thunderbird trunk with a hacked exptoolbar extension (generalized, committed changes happening soon), visophyte-js, and the new glodacloud extension.  It is a proof-of-easy-gloda-extensions as suggested by David Ascher.

The layout algorithm is what we in the business of making up terminology call a recursive sub-optimal tic-tac-toe subdivision thinger.  We under-use a neat (and somewhat slow) hack to find the bounds of the words through use of canvas.mozPathText and canvas.isPointInPath to sample a grid to know where the text is and isn’t.  It’s under-used because all we use it for right now is to find the actual height above the baseline that the text stretches to (because metrics only gives us the width).  We are lazy and don’t check below the baseline at all, and totally squander our chance to be cool and put small words in the gaps in larger words.  But given the amount of time spent, I’m very happy.

Oh, and of course it uses JS and Canvas.

I’ll be wanting that latte machine now…

in context

credits where credits due:

  • thread arcs a la the nice people at the IBM CUE group
  • the search view prototype is implemented by David Ascher.  the positioning of the visualization is on me as a quick hack, though.
  • the search view prototype is designed by Bryan Clark, and he has even better stuff on the way

The actual implementation is a first step of adapting knowledge from my python “visophyte” library to a JS implementation using canvas.  I am trying a more batch-oriented style of processing this time that uses explicit attributes for value-passing between logic blocks.  This is in comparison to the python implementation which is more functional in nature.  We’ll see how it turns out.

Log4Moz and Chainsaw (via new XMLFormatter/SocketAppender)

Log4Moz, the premier mozilla-centric javascript logging framework has just gotten more… premier.

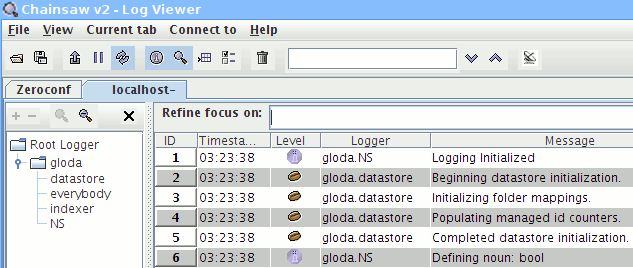
A picture of chainsaw with gloda

By hooking Log4Moz up to Chainsaw, Apache log4j’s pretty UI, we get a UI with some powerful features.  Namely, you can filter based on message text (using a regex even), level, source, etc.  Also, you can colorize the entries using the same expression mechanism.  In the screenshot below, you can see I have filtered to show only the messages with the word “noun” on them, and changed the background color of messages with “+++” in them.

Chainsaw! Gloda! Filters!

The enhancements made to Log4Moz are to provide an XMLFormatter that rolls in a similar fashion to log4j’s XMLLayout and a SocketAppender that never forgets… to kill!  And by kill, I mean establish TCP connections.

If you are a gloda user and upgraded to the version I told you to expressly not upgrade to, then you can use this new functionality by creating a file “/tmp/chainsaw.ptr” with the contents “localhost:4448”.  Run Chainsaw, create an XMLSocketReceiver, and Bob’s your uncle.  Unfortunately, Bob is not your uncle when it comes to building chainsaw.  While maven no longer entirely angries up my blood, the process still leaves something to be desired.  (Using this ~/.m2/settings.xml with “-P default” may take fewer years off your life if you take this path.)

These enhancements are currently in the gloda repository, and perhaps will make their way back upstream or what not?  (Land them quick, before I add all forms of crazy helpers like JSON-ing extra arguments and sending them across the wire too!)

UPDATE: Of course, it’s always a good idea to pull from the tip, as the revision linked above had a bit of foolishness with timeouts.

chroniquery does useful things!

Before pecobro, there was chroniquery (shiny, also shiny, texty), a python binding for roc‘s chronicle-recorder omega-debugger.  Now, there is still chroniquery.  It just does more stuff, and does the stuff it previously did more correctly.

In any event, what the awesome ‘screenshot’ (it’s from a console…) shows:

  • A trace from running chronicle-recorder against xpcshell on amd64 running a gloda unit test.
  • Javascript being ‘traced’ with extraction of the function name, script, and line number… everything you’d expect from your dtrace probes or your JSD hooks/venkman/firebug…
  • Hm… it seems to know something about an XPConnect call going down…
  • Oh noes!  It has escaped into the C++ codes!

Thunderbird full-text search prototype a la SQLite FTS3

Full-text search using FTS3.

Full-text search with a contact constraint.

The global database sqlite file resulting from indexing all of mozilla.dev.apps.thunderbird is about 13M for something like 4500 messages.  We’re providing FTS3 with the bodies (but not attachments!) of all the newsgroup messages and the subjects of the messages which initiate new threads.  For real usage, we will need to also index the subjects of each message.

Note that the message bodies have not been processed at all by the Thunderbird/gloda code before handing them off to FTS3.  So quoted messages get indexed even though it’s a lot of excess data.  We’re relying on FTS3 to do all stop-words, etc.  FTS3’s Porter stemming/tokenization is in use.

Thunderbird contact auto-completion… with bubbles!

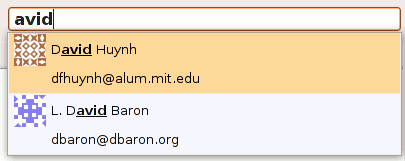
Autocompletion screenshot

Type type type type.  Autocomplete contact…

Completed contact becomes a bubble!  Bubble becomes a constraint, showing us only the messages involving the given contact.  (The idea is that you could then click on/select/whatever the bubble and change the constraint to be only to/from/cc/whatever if you are so inclined.)

Type type type, autocomplete, new constraint!  Now we’re looking at all the messages involving the two given contacts.  (Some of the messages with just one constraint were mailing list postings, but not explicitly involving the second contact.  This listing shows only messages where both contacts were directly involved.  We will have the ability to filter-out messages involving lists as desired, which may be desired by default in a case like this.)

What is exciting about this?

  • The contacts are matched using a suffix-tree implementation on a reduced set of contacts (as a first-pass).  In this case, those with sufficient ‘popularity’.  ‘Frecency’ a la ‘places’ is also planned.  And of course, we can hit the database as needed.  The suffix-tree is nice because it allows extremely rapid lookups while also allowing for substring matching.
  • The contact popularity is computed automatically by the gloda indexing process, taking into account both messages you receive and send.  (I think the current address-book code just increments popularity on send?)
  • I think the bubbles are cool.  (Hyperlink-styling would also work, but would not be cool.)
  • Having the text converted into an explicit object representation (bubbles) is better than just doing string filtering (as quicksearch does) because it allows explicit actions on the object given knowledge of the object type.
  • We can convert more than just contacts/identities to explicit objects.  As demonstrated at the summit, we have a plugin that detects bugzilla bug references in messages as well as (American/NANP-style) phone-numbers in messages.  We could detect these and promote them as well, etc.
  • The filtered messages are being delivered by gloda, the global database (backed by SQLite), which means that we aren’t searching just one folder.
  • There are a lot of places that you, the reader, will shortly be able to hack on and contribute to make this even more exciting.  A vicious cycle of exciting-ness will ensue until everyone is dancing in the streets.