Thunderbird contact auto-completion… with bubbles!

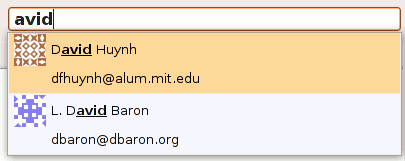
Autocompletion screenshot

Type type type type.  Autocomplete contact…

Completed contact becomes a bubble!  Bubble becomes a constraint, showing us only the messages involving the given contact.  (The idea is that you could then click on/select/whatever the bubble and change the constraint to be only to/from/cc/whatever if you are so inclined.)

Type type type, autocomplete, new constraint!  Now we’re looking at all the messages involving the two given contacts.  (Some of the messages with just one constraint were mailing list postings, but not explicitly involving the second contact.  This listing shows only messages where both contacts were directly involved.  We will have the ability to filter-out messages involving lists as desired, which may be desired by default in a case like this.)

What is exciting about this?

  • The contacts are matched using a suffix-tree implementation on a reduced set of contacts (as a first-pass).  In this case, those with sufficient ‘popularity’.  ‘Frecency’ a la ‘places’ is also planned.  And of course, we can hit the database as needed.  The suffix-tree is nice because it allows extremely rapid lookups while also allowing for substring matching.
  • The contact popularity is computed automatically by the gloda indexing process, taking into account both messages you receive and send.  (I think the current address-book code just increments popularity on send?)
  • I think the bubbles are cool.  (Hyperlink-styling would also work, but would not be cool.)
  • Having the text converted into an explicit object representation (bubbles) is better than just doing string filtering (as quicksearch does) because it allows explicit actions on the object given knowledge of the object type.
  • We can convert more than just contacts/identities to explicit objects.  As demonstrated at the summit, we have a plugin that detects bugzilla bug references in messages as well as (American/NANP-style) phone-numbers in messages.  We could detect these and promote them as well, etc.
  • The filtered messages are being delivered by gloda, the global database (backed by SQLite), which means that we aren’t searching just one folder.
  • There are a lot of places that you, the reader, will shortly be able to hack on and contribute to make this even more exciting.  A vicious cycle of exciting-ness will ensue until everyone is dancing in the streets.

gloda’s first (primitive) visualization

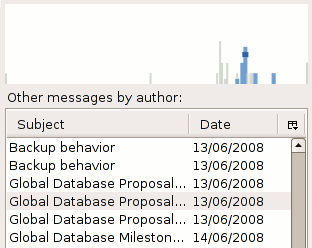
Author activity over time, current thread in blue, selected message in darkest blue.

A primitive visualization augments the gloda “other messages by author” listing by showing the messages sent by the author over time.  Messages are stacked by day.  The currently selected message is in darkest blue and also very wide.  Other messages from the same thread/conversation are in lighter blue and less wide.  Messages not in the conversation are light grey and rather narrow.

It’s not clickable, it lacks any form of scale or any feedback at all, and there are scaling issues.  (If anyone wants to save me the effort of figuring out how to get the canvas to maintain a 1:1 pixel mapping to the actual display and still ‘flex’ by adding/losing pixels, please do drop me a message or leave a comment.)  These will all change, but not yet.

I’ve pushed the changes to the mercurial repos and updated the stable tag, but I’m not publishing updated xpi’s, so you’ll need to roll your own if you care.  (The DB schema has not changed and so does not need to be blown away.)

gloda milestone 1

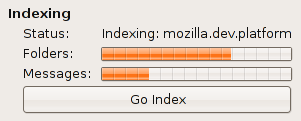
gloda m1 getting its indexing on

I am declaring milestone 1 of gloda (the global database extension for Thunderbird 3.x) / expmess (the experimental message view extension for Thunderbird 3.x) reached.  Milestone 1 basically consists of:

  • It statically indexes all of your folders.  It does not track changes made to your mailboxes.  It will become confused and angry as time goes on and your message stores change but it stays the same.  Thankfully, it is also passive aggressive and will merely stop doing useful things rather than trying to eat your data.  It also refuses to change its ways; if you try and trick it into indexing a message it has already processed but you moved, it will not update the message’s index.  You can, however, trick it into indexing new messages.
  • The indexing sorta happens in the background and has pretty, if dubious from an UX perspective, progress bars (see screenshot).  This was stolen from M3, making M1 wildly more usable than originally planned.  At least on my computer, I didn’t notice much performance impact from the indexing, but my system is arguably fairly beefy.  This can all be tweaked though, especially once we hook the nsIIdleService in.
  • It adds a “data mine” pane to the right side of the message window.  It has a splitter so you can hide it if you want, but you can never be rid of it.  The data mine shows you the other messages in the current thread and other messages sent by the author… globally!
  • If you double-click on a message in the “data mine” added by expmess, it will take you there!  This is stolen from M2.
  • It will print out a lot of debug on standard out.  It used to print more.

Having said all that, you can get the XPI’s here if you are using Thunderbird/Shredder 3.0a2pre or later, and your build is from July 5th 2008 or later.  You need to install both of them if you want anything interesting to happen.  The easiest way to do this is go to “Tools”…”Add-ons” in Shredder, and drag the links into the add-ons pane, at which point it will prompt you and such.  These extensions will not auto-update.

And the code (in mercurial) is here:

Because of the static indexing, you will probably want to install this extension, mention something about needing to wear sunglasses because of the brightness of the future, and then uninstall it.

Un-installation consists of:

  1. Disable / remove the gloda and expmess extensions.
  2. Delete the global-messages-db.sqlite file from your profile directory.  Or don’t.  It’s up to you.

I’ll be following this post up with a newsgroup post on mozilla.dev.apps.thunderbird on Monday with more details about planning out the rest of the milestones, as well as the arbitrary changes I had made to my (always tenative) milestone 1 plan.  Discussion about the global database is probably best directed to the newsgroup, but feel free to post comments here if you want too.

thunderbird global database m1-ish

The ‘gloda’ (global database) and ‘expmess’ (experimental message view) Thunderbird extensions are nearly to milestone 1…

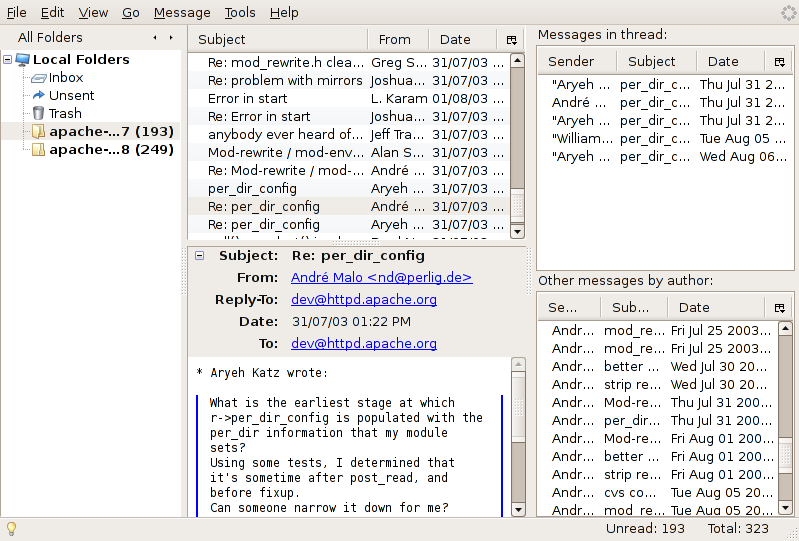
Thunderbird with gloda/expmess plugins m1-ish installed

The screenshot scenario is that we have 2 months of apache-dev archives in two separate folders, July and August.  We have a message selected in the month of July, yet the ‘data mine’ to the right is able to show the messages in the thread spanning both months (and therefore folders), as well as showing all the other messages sent by the author spanning both months (and therefore folders).

I’ll post again with some links and what not once I hit the actual milestone 1.  Be aware that every-day usability is targeted for milestone 3, but that should still happen pre-summit.

pecobro, the tell-you-who-reads/writes-what performance code browser

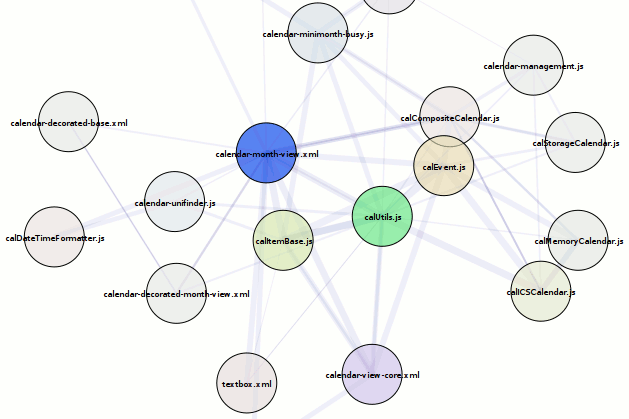
No cool pictures, but I’ve enhanced and exposed the global reader/writer understanding of javascript code.  In other words, pecobro now does a passable job at telling you what global variables a given javascript file reads from/writes to, and who else writes to/reads from those variables.  False negatives are expected (don’t rely on things to be exhaustive), and false positives are quite conceivable.

As an example starting point, take a look at messageWindow.js’s global reads or global writes.  From either of these you can click on other files in the sidebar to go to them.  There is no execution trace, so the overview diagram won’t be any help.  Be sure you have some free memory available and won’t try and hurt me if Firefox does something crazy.  Note: for long documents, some delay is expected as it attempts to apply various fix-ups.  Also note: clicking on things in the global reads/global writes tab won’t get you anywhere for now.

A quick example of a global read from that file (and who writes to that global):

gDBView

  • Top Level: commandglue.js
  • Function: ClearThreadPane (in commandglue.js)
  • Function: CreateBareDBView (in commandglue.js)
  • Function: RerootFolder (in commandglue.js)
  • Function: SwitchView (in commandglue.js)
  • Function: openFolderTab (in mailWindowOverlay.js)
  • Function: setMailTabState (in mailWindowOverlay.js)
  • Function: restorePreSearchView (in searchBar.js)
  • Function: MsgGroupBySort (in threadPane.js)

A quick example of a global write from that file (and who reads from that global):

SelectFolder

  • Function: OpenMessageByHeader (in mailContextMenus.js)
  • Function: OpenInboxForServer (in mailWindow.js)
  • Function: selectFolder (in mailWindow.js)
  • Function: openFolderTab (in mailWindowOverlay.js)
  • Function: LoadNavigatedToMessage (in messageWindow.js)
  • Function: LoadNavigatedToMessage (in msgMail3PaneWindow.js)
  • Function: OnLocationTreeSelect (in msgMail3PaneWindow.js)
  • Function: SelectServer (in msgMail3PaneWindow.js)
  • Function: loadStartFolder (in msgMail3PaneWindow.js)
  • Function: RenameFolder (in widgetglue.js)
  • Function: loadInboxForNewAccount (in accountUtils.js)
  • Function: DropOnFolderTree (in messengerdnd.js)
  • Function: CrossFolderNavigation (in msgViewNavigation.js)

The code, as always, is available at http://hg.mozilla.org/users/bugmail_asutherland.org/pecobro/

pecobro: the performance code browser (early stage)

At the beginning of last week, I had gotten dtrace working on a Mac Mini using the Mozilla javascript-provider probes.  Very cool stuff, but it left me with several questions about what would really be best to do next:

  • How do I best understand what I’m seeing?  (Most of the codebase is brand new to me…)
  • How do I share the data with others in a way that is both comprehensible and allows them to draw their own conclusions from the data?
  • What can I do to reduce the effort required to work on performance problems?

I was tempted to just try and just dig into the system so I could have something to show immediately, but I knew it would still take a while to see the big picture just using an editor/ctags/lxr/opengrok, even informed by dtrace.  And even then, that big picture doesn’t scale well; whatever picture I managed to formulate would be stuck inside my head…

So my solution was to try and build a tool that could help me accomplish my short-term goals soon, and have the potential to grow into a usable solution to all of the above… eventually.  The goal, in a nutshell, is to provide a code browser for javascript that is able to integrate performance information (retrieved from traces) alongside the code.  Seeing that lxr/mxr and opengrok didn’t understand javascript or XBL all that well, it also seemed feasible to try and improve on their browsing capabilities for javascript.  A far-down-the-road goal is also to be able to pull in information from the underlying C++ code as well, potentially leveraging dehydra, etc.  (This would primarily be for understanding what happens when we leave the javascript layer, not trying to be the same solution for C++ space.)

So what can it do so far?  You can go try it for yourself if you like as long as you keep your expectations very low and realize the current state does not reflect all of the bullet points below.  Also, you probably want firefox 3.0.  Or you can read my bullet points:

  • Parse custom DTrace script output!  The Mozilla DTrace probe points could probably use a little love to improve what we are able to get out.  Also, I think it’s betraying us somewhere.
  • Parse JavaScript! Sorta!  (I hacked in support for the regular expression syntax, but I haven’t corrected the ambiguity with division, so things with division break.  Also, there’s at least one or two other glitches that cause early termination.) [Yay antlr!]
  • Parse XBL!  Even with entity inlining!  Even when people put #ifdefs in the XML document! Sorta!  We don’t actually do anything intelligent with the XBL right now or with its JavaScript, but it won’t take much to get that much improved. [Yay elementtree!]
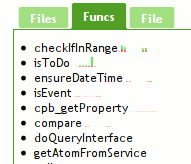
  • Visualize some stuff!  Inter-file relationship graph in the overview.  In the code and ‘Funcs’ sidebar tab you get a sparkbar where each bar represents a time interval.  The height of the par is the percentage of possible time we could have spent in that time interval.  Red means we belive that time was spent in the function itself, green means we think we spent that time in calls to other functions. [Yay visophyte!]
  • Navigate with history!  Click on the overview graph and you go to things.  Click on the file names in the ‘Files’ list and you go to the files.  I tried to make it so you could click on function names in the side bars to go to them, but jquery.scrollTo and/or firefox 3.0b5 had serious crashing issues.  [Yay jquery, jquery.history!]
  • See syntax-highlighted code with random headings intertwined (shows the parser worked) and potentially a visualization.  [Yay pygments!]

My hope in the near-term is to fix the outright bugs (parsing issues), get XBL going, and then augment the function information with more trace-derived data including more traditional call-stacks, etc.  Then the tool should be sufficiently usable that my immediate focus can change to creating automated tests to actually gather performance/execution traces so we can use the tool for what I started it for.  This may also get shelved for a while if it turns out that we need action (patches) immediately.

status/future fyi. no pictures.

I have accepted a position at Mozilla Messaging and will start at the end of March. Posting has been rare as of late and will be rare until then because my spare cycles are being given over to providing closure to my day-job projects, dealing with various hardware failures, and other small fires.

Hobby-wise, this will translate into a focus on visualizing e-mail from within Thunderbird. My nascent Python library, visophyte, will likely have a JavaScript sibling, but will not be abandoned.

Job-wise, I expect to focus on improving Thunderbird for both users and extension developers. Although my interest in creating a useful visualization extension will inform my efforts, it will not be my focus. Which is to say, do not worry that I will be engaging in flights of fancy and neglecting the core of Thunderbird. However, do be happy that good visualizations will depend on non-trivial data analysis and snappy, interactive behaviour and that this should translate into good things for Thunderbird, even if you don’t like shiny things.

It wasn’t an easy decision to leave my current employer (I have only great things to say about The PTR Group; check them out if you’re in the greater DC metro area), but Mozilla Messaging is an exceedingly rare opportunity that I could not pass up.

Thunderbird stacked linechart visualization

Stacked linechart visualization of j-devel by sender, march 05 through june 06, no sustain

The last post‘s visualization is put to work here visualizing the traffic on the j-devel mailing list (for the j text editor, but also beloved for armed bear common lisp) from March 2005 through now, June 13 2007, clustering on 7-day intervals. Each series is a specific author. ‘Sustain’, or the number of pixels of space to give to each series that doesn’t have traffic is at 0 because the number of one-time posters turns things into a mess of a lie. In the last post, sustain was at 2 because it made things prettier without significantly distorting the data. Decay might be a good compromise, although still introducing some distortion; really, the visualization then becomes a graph of ‘perceived activity’.

Not too many changes to do this; added a polygon renderer to the mozilla svg renderer backend and implemented an extremely naive type-dispatching in the thunderbird datafeed provider to fall back to the native python dispatcher so that it can process the aggregate nodes.

I should also note that there are just enough posters to the list to make the fallacy of using consecutive HSV points for consecutive data-series without additional variability a bad idea. At the bottom the two purplish colors pretty nearly blend together. Since the series may appear and disappear at will, it’s not sufficient to just hop the saturation or value between two values for alternating colors. Probably the thing to do is to ensure a minimal distance in the color-space and either spiraling in through the color wheel or just have multiple circles on the color wheel. We run out of usable colors eventually there too, but we can always fall-back to a graph-coloring algorithm to cheat and provide sufficient contrast between more closely spaced colors (in color-space; and forget perceptual color-space).

UPDATE:

Stacked linechart visualization of j-devel by sender, march 05 through june 06, no sustain, bottom align

Er, so, looking at the visualization a little more, I realized if I’m going to talk about distortion, I should probably admit that the naive centering-layout algorithm probably hoses things up too.  So, to my loyal readers entirely consisting of people foolish enough to click on links I send them via IM, you get a bonus visualization which is the exact same thing as the above, but with the alignment routine set to ‘bottom’, which is arguably more accurate.

An actual thunderbird email visualization, at last!

I have long had the goal of doing some form of e-mail visualization. After many false starts (for both Thunderbird and Outlook), I finally have something to show:

Graphito vis example 2

Now, of course, there are all kinds of caveats. This is all done in Python using PyXPCOM and PyDOM (hooray Mark Hammond!) The bad news is that the Python code is still unable to interact with the JavaScript pieces of Thunderbird. The good news is Mark Hammond already has a solution to allow Python and JavaScript to interact somewhat transparently (on bug 327689). Unfortunately, the patch does not work out of box for me, although it may be due to some underlying PyXPCOM problem that I still need to look into; I can’t even instantiate the error number service via PyXPCOM.

Since I haven’t implemented the labelling required to make the screenshot remotely intuitive, here’s an explanation of the visualization accompanied by a simpler picture generated by a test program using static data and the aggdraw renderer (no Thunderbird involved for this one):

Visualization using aggdraw to render from test data.

  • Time flows from left-to-right, old-to-new.
  • The background represents the days of the week and standard 9-5 business hours. Dark grey for the weekends, lighter grey for the week days, and then bands of even lighter gray for the 9-5 business hours on week days. The background should simplify when dealing with larger time-scales, but that’s down the line.
  • Nodes are placed vertically so that each horizontal strip corresponds to a single e-mail address. All nodes are colored based on their author.
    • Opaque squares represent an e-mail from that person (the one who owns/is the strip) to me, the user of the program.
    • Alpha-blended squares represent that person receiving a copy of the e-mail (‘to:’ only currently).
    • Circles represent me, the user of the program, having sent an e-mail to that person. If I sent it to many people, they each were on the ‘to:’ line.
  • Lines connect an e-mail with the message it is in reply to. Alpha-blended lines accompany alpha-blended nodes.

The first two visualizations are from a somewhat recent trunk build of Thunderbird with python and svg turned on. I have omitted the rest of the Thunderbird window because I’d just have to blur most of it out anyways. The data-sets come from two different folders that I copied interesting sets of messages to (including the messages from the thread in my ‘sent’ folder). Because of the aforementioned lack of javascript interaction, clicking on a node does nothing. However, I do print out info on the message when you hover over it or click on it. This is actually specified via the visualization infrastructure, it’s the ‘control’ object which just prints it out in a debug fashion.

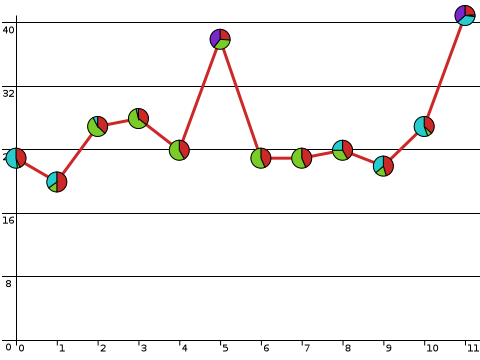
Filler visualization, also by visophyte, rather silly though.[1]

The visualizations are powered by the python ‘visophyte’ library which I have been developing. Visophyte is the successor to the koalaRainbow Movable Type plugin I wrote for the Movable Type 3.1 plugin contest. koalaRainbow (for MT) was more of a simple procedural drawing markup mechanism fronting a query-language than a visualization engine. Its visualization definitions were incomprehensible due to a lack of any real abstraction. With any luck, visophyte will suffer the excesses of too much abstraction. koalaRainbow (for MT) died because #1 I wrote it in order to learn Perl so that I could legitimately dislike Perl, and #2 I favor Python for all my scripting. Visophyte will enjoy continual development because I love visualization and I use python all over the place.

One important note from the outset is that although I am a fan of PyXPCOM, I doubt visophyte as it exists would be appropriate for an email visualization plugin for thunderbird that would enjoy wide usage. Developing a JavaScript visualization engine would be much less reusable for my purposes, so I’m not doing that. One possibility might be to compile the visualizations to javascript, optimizing them as we go, a la pyjamas.

1: This visualization is just here to break up the text. It is also a visophyte simple test, but rather silly. It is unlikely anyone would really want a line chart with pie charts at each point. The line itself shows total sales by month, whereas the pie-chart shows a sales breakdown among products for that specific month. A stacked area chart would be the ‘sane’ alternative to this graph, though we could have multiple lines/pies here, I’m just too lazy to make up the data.