Documentation for complex things (you don’t basically already understand)

The Problem

One of my focuses at MoMo is to improve the plight of Thunderbird extension developers.  An important aspect of this is improving the platform they are exposed to.  Any platform usually entails a fair amount of complexity.  The trick is that you only pay for the things that are new-to-you, learning-wise.

The ‘web’ as a platform is not particularly simple; it’s got a lot of pieces, some of which are fantastically complex (ex: layout engines).  But those bits are frequently orthogonal, can be learned incrementally, have reams of available documentation, extensive tools that can aid in understanding, and, most importantly, are already reasonably well known to a comparatively large population.  The further you get from the web-become-platform, the more new things you need to learn and the more hand-holding you need if you’re not going to just read the source or trial-and-error your way through.  (Not that those are bad ways to roll; but not a lot of people make it all the way through those gauntlets.)

I am working to make Thunderbird more extensible in more than a replace-some-function/widget-and-hope-no-other-extensions-had-similar-ideas sort of way.  I am also working to make Thunderbird and its extensions more scalable and performant without requiring a lot of engineering work on the part of every extension.  This entails new mini-platforms and non-trivial new things to learn.

There is, of course, no point in building a spaceship if no one is going to fly it into space and fight space pirates.  Which is to say, the training program for astronauts with all its sword-fighting lessons is just as important as the spaceship, and just buying them each a copy of “sword-fighting for dummies who live in the future” won’t cut it.

Translating this into modern-day pre-space-pirate terminology, it would be dumb to make a super fancy extension API if no one uses it.  And given that the platform is far enough from pure-web and universally familiar subject domains, a lot of hand-holding is in order.  Since there is no pre-existing development community familiar with the framework, they can’t practically be human hands either.

The Requirements

I assert the following things are therefore important for the documentation to be able to do:

  • Start with an explained, working example.
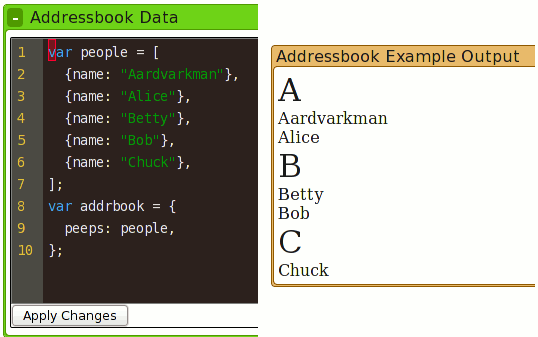
  • Let the student modify the example with as little work on their part as possible so that they can improve their mental model of how things actually work.
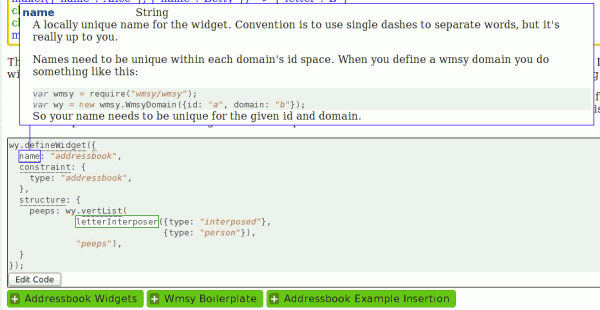
  • Link to other relevant documentation that explains what is going on, especially reference/API docs, without the user having to open a browser window and manually go search/cross-reference things for themselves.
  • Let the student convert the modified example into something they can then use as the basis for an extension.

The In-Process Solution: Narscribblus

So, I honestly was quite willing to settle for an existing solution that was anywhere close to what I needed.  Specifically, the ability to automatically deep-link source code to the most appropriate documentation for the bits on hand.  It has become quite common to have JS APIs that take an object where you can have a non-trivial number of keys with very specific semantics, and my new developer friendly(-ish) APIs are no exception.

Unfortunately, most existing JavaScript documentation tools are based on the doxygen/JavaDoc model of markup that:

  • Was built for static languages where your types need to be defined.  You can then document each component of the type by hanging doc-blocks off them.  In contrast, in JS if you have a complex Object/dictionary argument that you want to hang stuff of of, your best bet may be to just create a dummy object/type for documentation purposes.  JSDoc and friends do support a somewhat enriched syntax  like “@param arg.attr”, but run into the fact that the syntax…
  • Is basically ad-hoc with limited extensibility.  I’m not talking about the ability to add additional doctags or declare specific regions of markup that should be passed through a plugin, which is pretty common.  In this case, I mean that it is very easy to hit a wall in the markup language that you can’t resolve without making an end-run around the existing markup language entirely.  As per the previous bullet point, if you want to nest rich type definitions, you can quickly run out of road.

The net result is that it’s hard to even describe the data types you are working with, let alone have tools that are able to infer links into their nested structure.

So what is my solution?

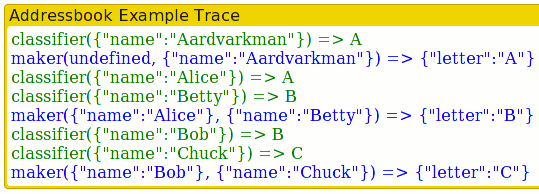
  • Steal as much as possible from Racket (formerly PLT Scheme)’s documentation tool, Scribble.  To get a quick understanding of the brilliance of Racket and Scribble, check out the quick introduction to racket.  For those of you who don’t click through, you are missing out on examples that automatically hyperlink to the documentation for invoked methods, plus pictures capturing the results of the output in the document.
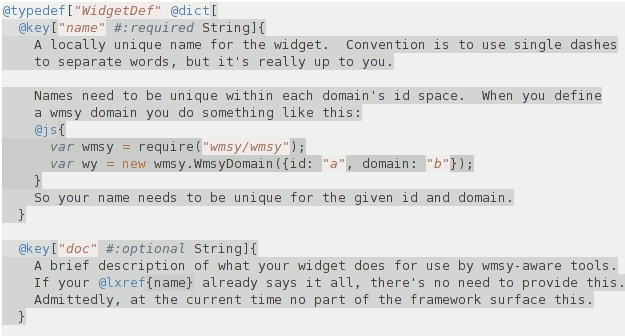
    • We steal the syntax insofar as it is possible without implementing a scheme interpreter.  The syntax amounts to @command[s-expression stuff where whitespace does not matter]{text stuff which can have more @command stuff in it and whitespace generally does matter}.  The brilliance is that everything is executed and there are no heuristics you need to guess at and that fall down.
    • Our limitation is that while Racket is a prefix language and can use reader macros and have the entire documents be processed in the same fashion as source code and totally understood by the text editor, such purity is somewhat beyond us.  But we do what we can.
  • Use narcissus, Brendan Eich/mozilla’s JS meta-circular interpreter thing, to handle parsing JavaScript.  Although we don’t have reader macros, we play at having them.  If you’ve ever tried to parse JavaScript, you know it’s a nightmare that requires the lexer to be aware of the parsing state thanks to the regexp syntax.  So in order for us to be able to parse JavaScript inline without depending on weird escaping syntaxes, when parsing our documents we use narcissus to make sure that we parse JavaScript as JavaScript; we just break out when we hit our closing squiggly brace.  No getting tricked by regular expressions, comments, etc.
  • Use the abstract interpreter logic from Patrick Walton‘s jsctags (and actually stole its CommonJS-ified narcissus as the basis for our hacked up one too) as the basis for abstract interpretation to facilitate being able to linkify all our JavaScript code.  The full narcissus stack is basically:
    • The narcissus lexer has been modified to optionally generate a log of all tokens it generates for the lowest level of syntax highlighting.
    • The narcissus parser has been modified to, when generating a token log, link syntax tokens to their AST parse nodes.
    • The abstract interpreter logic has been modified to annotate parse nodes with semantic links so that we can traverse the tokens to be able to say “hey, this is attribute ‘foo’ in an object that is argument index 1 of an invocation of function ‘bar'” where we were able to resolve bar to a documented node somewhere.  (We also can infer some object/class organization as a result of the limited abstract interpretation.)
    • We do not use any of the fancy static analysis stuff that is going on as of late with the DoctorJS stuff.  Automated stuff is sweet and would be nice to hook in, but the goal here is friendly documentation.
    • The abstract interpreter has been given an implementation of CommonJS require that causes it to load other source documents and recursively process them (including annotating documentation blocks onto them.)
  • We use bespin as the text editor to let you interactively edit code and then see the changes.  Unfortunately, I did not hook bespin up to the syntaxy magic we get when we are not using bespin.  I punted because of CommonJS loader snafus.  I did, however, make the ‘apply changes’ button use narcissus to syntax check things (with surprisingly useful error messages in some cases).

Extra brief nutshell facts:

  • It’s all CommonJS code.  The web enabled version which I link to above and below runs using a slightly modified version of Gozala‘s teleport loader.  It can also run privileged under Jetpack, but there are a few unimplemented sharp edges relating to Jetpack loader semantics.  (Teleport has been modified mainly to play more like jetpack, especially in cases where its aggressive regexes go looking for jetpack libs that aren’t needed on the web.)  For mindshare reasons, I will probably migrate off of teleport for web loading and may consider adding some degree of node.js support.  The interactive functionality currently reaches directly into the DOM, so some minor changes would be required for the server model, but that was all anticipated.  (And the non-interactive “manual” language already outputs plain HTML documents.)
  • The web version uses a loader to generate the page which gets displayed in an iframe inside the page.  The jetpack version generates a page and then does horrible things using Atul‘s custom-protocol mechanism to get the page displayed but defying normal browser navigation; it should either move to an encapsulated loader or implement a proper custom protocol.

Anywho, there is still a lot of work that can and will be done (more ‘can’ than ‘will’), but I think I’ve got all the big rocks taken care of and things aren’t just blue sky dreams, so I figure I’d give a brief intro for those who are interested.

Feel free to check out the live example interactive tutorialish thing linked to in some of the images, and its syntax highlighted source.  Keep in mind that lots of inefficient XHRs currently happen, so it could take a few seconds for things to happen.  The type hierarchy emission and styling still likely has a number of issues including potential failures to popup on clicks.  (Oh, and you need to click on the source of the popup to toggle it…)

Here’s a bonus example to look at too, keeping in mind that the first few blocks using the elided js magic have not yet been wrapped in something that provides them with the semantic context to do magic linking.  And the narscribblus repo is here.

(clicky.visophyte.org-hosted CouchDB services offline)

This means doccelerator and my Tinderbox scraper that chucked stuff into a CouchDB for exposure by a modified bugzilla jetpack.  Either couch went crazy or someone gave it a request that is ridiculously expensive to answer with a database the accumulated size of the tinderbox database.  I’m not aware of any trivial ways to contend with the latter.  Judging by the logs, it looks like 2 people other than myself used these services, so, my apologies to those cool, insightful, forward-looking individuals.

The specific services are probably not coming back.  doccelerator is being subsumed into something else that better meets documentation needs and will be more fully baked, more on that soon.  I got the impression at the summit that the tinderbox problem is in hand, or very close to someone’s hand; maybe one of those robot grabby-arm things is involved?  My reviewboard with bugzilla hacks instance is sticking around for the time being, but I think wheels are turning elsewhere in Mozilla on that front too, so hopefully my install is mooted before it falls over.

Lest there be any doubt, all clicky services are provided on a self-interested basis… I am happy when they benefit others, but I do these things for the benefit of my own productivity/sanity and they are hosted using my own resources.  (While I had higher hopes for doccelerator, the MoMo-resourced couchdb service provisioning never happened so doccelerator never got pushed public with nightly updates because of said clicky resource constraints.)

Using VMWare Record/Replay and VProbes for low time-distortion performance profiling

profile-performance-graph-enumerateProps

The greatest problem with performance profiling is getting as much information as possible while affecting the results as little as possible.  For my work on pecobro I used mozilla’s JavaScript DTrace probes.  Because the probes are limited to notifications of all function invocations/returns with no discretion and there is no support for JS backtraces, the impact on performance was heavy.  Although I have never seriously entertained using chronicle-recorder (via chroniquery) for performance investigations, it is a phenomenal tool and it would be fantastic if it were usable for this purpose.

VMware introduced with Workstation 6/6.5 the ability to efficiently record VM execution by recording the non-deterministic parts of VM execution.  When you hit the record button it takes a snapshot and then does its thing.  For a 2 minute execution trace where Thunderbird is started up and gloda starts indexing and adaptively targets for 80% cpu usage, I have a 1G memory snapshot (the amount of memory allocated to the VM), a 57M vmlog file, and a 28M vmsn file.  There is also and a 40M disk delta file (against the disk snapshot), but I presume that’s a side effect of the execution rather than a component of it.

The record/replay functionality is the key to being able to analyze performance while minimizing the distortion of the data-gathering mechanisms.  There are apparently a lot of other solutions in the pipeline, many of them open source.  VMware peeps apparently also created a record/replay-ish mechanism for valgrind, valgrind-rr, which roc has thought about leveraging for chronicle-recorder.  I have also heard of Xen solutions to the problem, but am not currently aware of any usable solutions today.  And of course, there are many precursors to VMware’s work, but this blog post is not a literature survey.

There are 3 ways to get data out of a VM under replay, only 2 of which are usable for my purposes.

  1. Use gdb/the gdb remote target protocol.  The VMware server opens up a port that you can attach to.  The server has some built-in support to understand linux processes if you spoon feed it some critical offsets.  Once you do that, “info threads” lists every process in the image as a thread which you can attach to.  If you do the dance right, gdb provides perfect back-traces and you can set breakpoints and generally do your thing.  You can even rewind execution if you want, but since that means restoring state at the last checkpoint and running execution forward until it reaches the right spot, it’s not cheap.  In contrast, chronicle-recorder can run (process) time backwards, albeit at a steep initial cost.
  2. Use VProbes.  Using a common analogy, dtrace is like a domesticated assassin black bear that comes from the factory understanding English and knowing how to get you a beer from the fridge as well as off your enemies.  VProbes, in contrast, is a grizzly bear that speaks no English.  Assuming you can convince it to go after your enemies, it will completely demolish them.  And you can probably teach it to get you a beer too, it just takes a lot more effort.
  3. Use VAssert.  Just like asserts only happen in debug builds, VAsserts only happen during replay (but not during recording).  Except for the requirement that you think ahead to VAssert-enable your code, it’s awesome because, like static dtrace probes, you can use your code that already understands your code rather than trying to wail on things from outside using gdb or the like.  This one was not an option because it is Windows only as of WS 6.5.  (And Windows was not an option because building mozilla in a VM is ever so slow, and, let’s face it, I’m a linux kind of guy.  At least until someone buys me a solid gold house and a rocket car.)

profile-performance-graph-callbackDriver-doubleClicked

My first step in this direction has been using a combination of #1 and #2 to get javascript backtraces using a timer-interval probe.  The probe roughly does the following:

  • Get a pointer to the current linux kernel task_struct:
    • Assume we are uniprocessor and retrieve the value of x86_hw_tss.sp0 from the TSS struct for the first processor.
    • Now that we know the per-task kernel stack pointer, we can find a pointer to the task_struct at the base of the page.
  • Check if the name of our task is “thunderbird-bin” and bail if it is not.
  • Pull the current timestamp from the linux kernel maintained xtime.  Ideally we could use VProbe’s getsystemtime function, but it doesn’t seem to work and/or is not well defined.  Our goal is to have a reliable indicator of what the real time is at this stage in the execution, because with a rapidly polling probe our execution will obviously be slower than realtime.  xtime is pretty good for this, but ticks at 10ms out of box (Ubuntu 9.04 i386 VM-targeted build), which is a rather limited granularity.  Presumably we can increase its tick rate, but not without some additional (though probably acceptable) time distortion.
  • Perform a JS stack dump:
    • Get XPConnect’s context for the thread.
      • Using information from gdb on where XPCPerThreadData::gTLSIndex is, load the tls slot.  (We could also just directly retrieve the tls slot from gdb.)
      • Get the NSPR thread private data for that TLS slot.
        • Using information from gdb on where pt_book is located, get the pthread_key for NSPR’s per-thread data.
        • Using the current task_struct from earlier, get the value of the GS segment register by looking into tls0_base and un-scrambling it from its hardware-specific configuration.
        • Use the pthread_key and GS to traverse the pthread structure and then the NSPR structure…
      • Find the last XPCJSContextInfo in the nsTArray in the XPCJSContextStack.
    • Pull the JSContext out, then get its JSStackFrame.
    • Recursively walk the frames (no iteration), manually/recursively (ugh) “converting” the 16-bit characters into 8-bit strings through violent truncation and dubious use of sprintf.

The obvious-ish limitation is that by relying on XPConnect’s understanding of the JS stack, we miss out on the most specific pure interpreter stack frames at any given time.  This is mitigated by the fact that XPConnect is like air to the Thunderbird code-base and that we still have the functions higher up the call stack.  This can also presumably be addressed by detecting when we are in the interpreter code and poking around.  It’s been a while since I’ve been in that part of SpiderMonkey’s guts… there may be complications with fast natives that could require clever stack work.

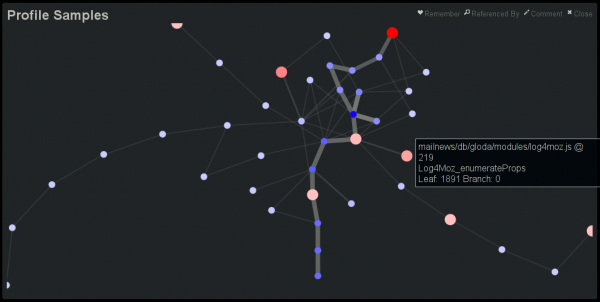
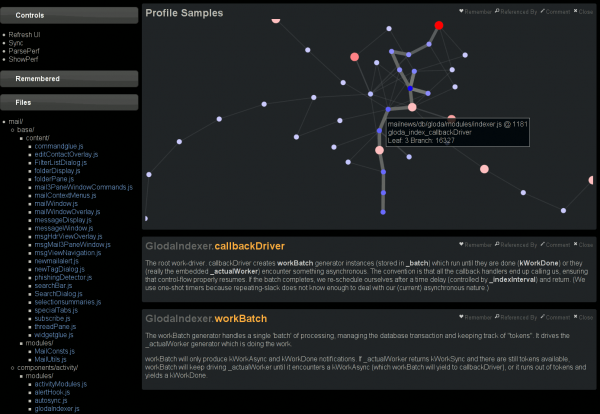
This blog post is getting rather long, so let’s just tie this off and say that I have extended doccelerator to be able to parse the trace files, spitting the output into its own CouchDB database.  Then doccelerator is able to expose that data via Kyle Scholz‘s JSViz in an interactive force-directed graph that is related back to the documentation data.  The second screenshot demonstrates that double-clicking on the (blue) node that is the source of the tooltip brings up our documentation on GlodaIndexer.callbackDriver.  doccelerator hg repovprobe emmett script in hg repo.

See a live demo here.  It will eat your cpu although it will eventually back off once it feels that layout has converged.  You should be able to drag nodes around.  You should also be able to double-click on nodes and have the documentation for that function be shown *if it is available*.  We have no mapping for native frames or XBL stuff at this time.  Depending on what other browsers do when they see JS 1.8 code, it may not work in non-Firefox browsers.  (If they ignore the 1.8 file, all should be well.)  I will ideally fix that soon by adding an explicit extension mechanism.

Doccelerator: JavaScript documentation via JSHydra into CouchDB with an AJAX UI

doccelerator-1

About the name.  David Ascher picked it.  My choice was flamboydoc in recognition of my love of angry fruit salad color themes and because every remotely sane name has already been used by the 10 million other documentation tools out there.  Regrettably not only have we lost the excellent name, but the color scheme is at best mildly irritated at this point.

So why yet another JavaScript documentation tool:

  • JavaScript 1.8 support.  JSHydra (thanks jcranmer!) is built on spidermonkey.  In terms of existing JS documentation tools out there, they can be briefly lumped into “doesn’t even both attempting to parse JavaScript” and “parses it to some degree, but gets really confused by JavaScript 1.8 syntax”.  By having the parser be the parser of our  JS engine, parsing success is guaranteed.  And non-parsing tools tend to require too much hand labeling to be practical.
  • Docceleterator is not intended to be just a documentation tool.  While JSHydra is still in its infancy, it promises the ability to extract information from function bodies.  Its namesake, Dehydra, is a static analysis tool for C++ and has already given us great things (dxr, also in its infancy).

doccelerator-comment

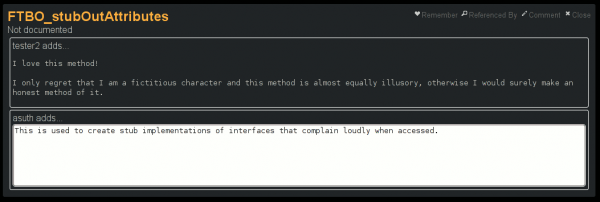
  • Support community API docs contributions without forking the API docs or requiring source patches.  DevMo is a great place for documentation, but it is an iffy place for doxygen-style API docs.  Short of an exceedingly elaborate tool that round-trips doxygen/JSDoc comments to the wiki and user modifications back again, the documentation is bound to diverge.  By supporting comments directly on the semantic objects themselves[1], we eliminate having to try and determine what a given wiki change corresponds to.  (This would be annoying even if you could force the wiki users to obey a strict formatting pattern.)  This enables automatic patch generation, etc.
  • Mashable.  You post the JavaScript source file to a server running the doccelerator parser.  You get back a JSON set of documents.  You post those into a CouchDB couch.  The UI is a CouchApp; you can modify it.  Don’t like the UI, just want a service?  You can query the couch for things and get back JSON documents.  Want custom (CouchDB) views but are not in control of a documentation couch?  Replicate the couch to your own local couch and add some views.
  • Able to leverage data from dehydra/dxr.  Mozilla JS code lives in a world of XPCOM objects and their XPIDL-defined interfaces.  We want the JS documentation to be able to interact with that world.  Obviously, this raises some issues of where the boundary lies between dxr and Doccelerator.  I don’t think it matters at this point; we just need internal and API documentation for Thunderbird 3 now-ish.
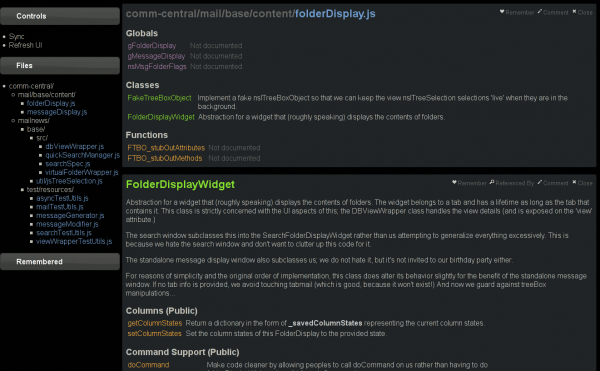
  • A more ‘dynamic’ UI.  The UI is inspired by TiddlyWiki‘s interface where all wiki “pages” open in the same document.  I often find myself only caring about a few methods of a class at any given time.  Documentation is generally either organized in monolithic pages or single pages per function.  Either way, I tend to end up with a separate tab for each thing of interest.  This usually ends in both confusion and way too many tabs.

1: Right now I only support commenting at the documentation display granularity which means you cannot comment on arguments individually, just the function/method/class/etc.

Example links which will eventually die because I’m not guaranteeing this couch instance will stay up forever:

The hg repo is here.  I tried to code the JS against the 1.5 standard and generally be cross-browser compatible, but I know at least Konqueror seems to get upset when it comes time to post (modified) comments.  I’m not sure what’s up with that.

Exciting potential taglines:

  • Doccelerator: Documentation from the future, because the documentation was doccelerated past the speed of light, and we all know how that turns out.
  • Doccelerator: It sounds like an extra pedal for your car and it’s just as easy to use… unless we’re talking about the clutch.
  • Doccelerator: Thankfully the name doesn’t demand confusingly named classes in the service of a stretched metaphor.  That’s good, right?