Using VMWare Record/Replay and VProbes for low time-distortion performance profiling

profile-performance-graph-enumerateProps

The greatest problem with performance profiling is getting as much information as possible while affecting the results as little as possible.  For my work on pecobro I used mozilla’s JavaScript DTrace probes.  Because the probes are limited to notifications of all function invocations/returns with no discretion and there is no support for JS backtraces, the impact on performance was heavy.  Although I have never seriously entertained using chronicle-recorder (via chroniquery) for performance investigations, it is a phenomenal tool and it would be fantastic if it were usable for this purpose.

VMware introduced with Workstation 6/6.5 the ability to efficiently record VM execution by recording the non-deterministic parts of VM execution.  When you hit the record button it takes a snapshot and then does its thing.  For a 2 minute execution trace where Thunderbird is started up and gloda starts indexing and adaptively targets for 80% cpu usage, I have a 1G memory snapshot (the amount of memory allocated to the VM), a 57M vmlog file, and a 28M vmsn file.  There is also and a 40M disk delta file (against the disk snapshot), but I presume that’s a side effect of the execution rather than a component of it.

The record/replay functionality is the key to being able to analyze performance while minimizing the distortion of the data-gathering mechanisms.  There are apparently a lot of other solutions in the pipeline, many of them open source.  VMware peeps apparently also created a record/replay-ish mechanism for valgrind, valgrind-rr, which roc has thought about leveraging for chronicle-recorder.  I have also heard of Xen solutions to the problem, but am not currently aware of any usable solutions today.  And of course, there are many precursors to VMware’s work, but this blog post is not a literature survey.

There are 3 ways to get data out of a VM under replay, only 2 of which are usable for my purposes.

  1. Use gdb/the gdb remote target protocol.  The VMware server opens up a port that you can attach to.  The server has some built-in support to understand linux processes if you spoon feed it some critical offsets.  Once you do that, “info threads” lists every process in the image as a thread which you can attach to.  If you do the dance right, gdb provides perfect back-traces and you can set breakpoints and generally do your thing.  You can even rewind execution if you want, but since that means restoring state at the last checkpoint and running execution forward until it reaches the right spot, it’s not cheap.  In contrast, chronicle-recorder can run (process) time backwards, albeit at a steep initial cost.
  2. Use VProbes.  Using a common analogy, dtrace is like a domesticated assassin black bear that comes from the factory understanding English and knowing how to get you a beer from the fridge as well as off your enemies.  VProbes, in contrast, is a grizzly bear that speaks no English.  Assuming you can convince it to go after your enemies, it will completely demolish them.  And you can probably teach it to get you a beer too, it just takes a lot more effort.
  3. Use VAssert.  Just like asserts only happen in debug builds, VAsserts only happen during replay (but not during recording).  Except for the requirement that you think ahead to VAssert-enable your code, it’s awesome because, like static dtrace probes, you can use your code that already understands your code rather than trying to wail on things from outside using gdb or the like.  This one was not an option because it is Windows only as of WS 6.5.  (And Windows was not an option because building mozilla in a VM is ever so slow, and, let’s face it, I’m a linux kind of guy.  At least until someone buys me a solid gold house and a rocket car.)

profile-performance-graph-callbackDriver-doubleClicked

My first step in this direction has been using a combination of #1 and #2 to get javascript backtraces using a timer-interval probe.  The probe roughly does the following:

  • Get a pointer to the current linux kernel task_struct:
    • Assume we are uniprocessor and retrieve the value of x86_hw_tss.sp0 from the TSS struct for the first processor.
    • Now that we know the per-task kernel stack pointer, we can find a pointer to the task_struct at the base of the page.
  • Check if the name of our task is “thunderbird-bin” and bail if it is not.
  • Pull the current timestamp from the linux kernel maintained xtime.  Ideally we could use VProbe’s getsystemtime function, but it doesn’t seem to work and/or is not well defined.  Our goal is to have a reliable indicator of what the real time is at this stage in the execution, because with a rapidly polling probe our execution will obviously be slower than realtime.  xtime is pretty good for this, but ticks at 10ms out of box (Ubuntu 9.04 i386 VM-targeted build), which is a rather limited granularity.  Presumably we can increase its tick rate, but not without some additional (though probably acceptable) time distortion.
  • Perform a JS stack dump:
    • Get XPConnect’s context for the thread.
      • Using information from gdb on where XPCPerThreadData::gTLSIndex is, load the tls slot.  (We could also just directly retrieve the tls slot from gdb.)
      • Get the NSPR thread private data for that TLS slot.
        • Using information from gdb on where pt_book is located, get the pthread_key for NSPR’s per-thread data.
        • Using the current task_struct from earlier, get the value of the GS segment register by looking into tls0_base and un-scrambling it from its hardware-specific configuration.
        • Use the pthread_key and GS to traverse the pthread structure and then the NSPR structure…
      • Find the last XPCJSContextInfo in the nsTArray in the XPCJSContextStack.
    • Pull the JSContext out, then get its JSStackFrame.
    • Recursively walk the frames (no iteration), manually/recursively (ugh) “converting” the 16-bit characters into 8-bit strings through violent truncation and dubious use of sprintf.

The obvious-ish limitation is that by relying on XPConnect’s understanding of the JS stack, we miss out on the most specific pure interpreter stack frames at any given time.  This is mitigated by the fact that XPConnect is like air to the Thunderbird code-base and that we still have the functions higher up the call stack.  This can also presumably be addressed by detecting when we are in the interpreter code and poking around.  It’s been a while since I’ve been in that part of SpiderMonkey’s guts… there may be complications with fast natives that could require clever stack work.

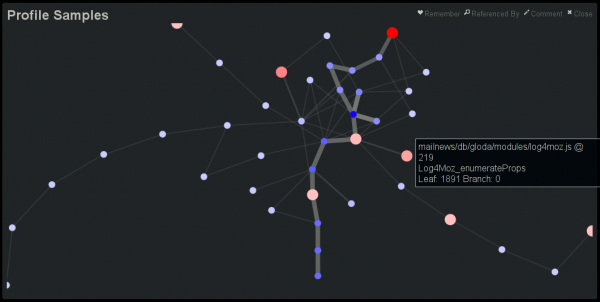
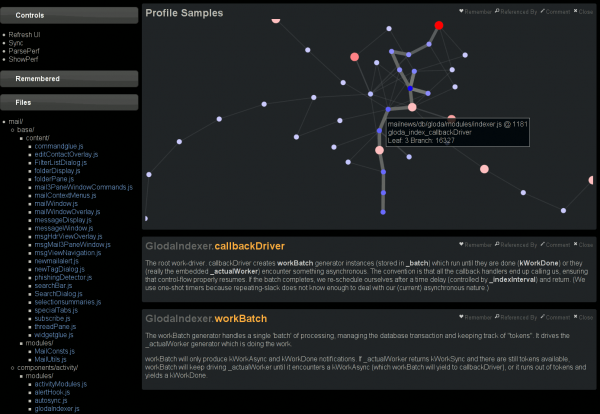
This blog post is getting rather long, so let’s just tie this off and say that I have extended doccelerator to be able to parse the trace files, spitting the output into its own CouchDB database.  Then doccelerator is able to expose that data via Kyle Scholz‘s JSViz in an interactive force-directed graph that is related back to the documentation data.  The second screenshot demonstrates that double-clicking on the (blue) node that is the source of the tooltip brings up our documentation on GlodaIndexer.callbackDriver.  doccelerator hg repovprobe emmett script in hg repo.

See a live demo here.  It will eat your cpu although it will eventually back off once it feels that layout has converged.  You should be able to drag nodes around.  You should also be able to double-click on nodes and have the documentation for that function be shown *if it is available*.  We have no mapping for native frames or XBL stuff at this time.  Depending on what other browsers do when they see JS 1.8 code, it may not work in non-Firefox browsers.  (If they ignore the 1.8 file, all should be well.)  I will ideally fix that soon by adding an explicit extension mechanism.

master control pecobro, the overkill performance code browser

The title isn’t true yet, but it’s disturbingly almost-true.  Pecobro’s hackish underpinnings have been “accidentally” replaced with surprisingly forward-looking code capable of supporting a much fancier feature set.  (I didn’t mean to, but I got tricked because the incremental cost to doing the ‘right thing’ was always so low.)

The trace that you can see here, by clicking on any of this text what has coloring (and using firefox 3 in a session that you don’t mind if it crashes), is of running Mark Banner (Standard8)‘s Thunderbird bloatTest on OS X with DTrace probes enabled, but without actually doing the bloat testing.  So Thunderbird starts up, opens the address book, closes it, opens the compose window, closes it, and then quits.

Here is a preliminary processed trace from a run triggering bug 296453.  Be forewarned that there is some missing information from the underlying trace and so it’s not all that it could be.  I think the XPConnect probes need to be fleshed out slightly more (and processed).

The code (both pecobro and mozilla codebase patches) is at: http://hg.mozilla.org/users/bugmail_asutherland.org/

What crazy overkill things can pecobro do now?

  • Parse all of the javascript code used in Thunderbird, including nearly all (maybe all?) of the 1.x enhancements.  The parser is still a bit hackish, especially when it comes to support of regexes, but it actually parses things.  Thanks to Chris Lambrou for posting his initial JavaScript.g antlr3 grammar (and BSD licensing it) that I used as a basis for my hacky version.  This was certainly a learning experience; I now know that javascript can never replace python in my heart…
  • Find all of the places functions can be defines in javascript code and do a pretty good job at figuring out reasonable names for them.  This even includes “(new)? Function()”.  This allows us to use the function-info DTrace probes to use line number information to identify functions.  We do this so that we can identify anonymous functions.
  • Handle XBL as well as we handle pure-javascript files.  (Parsing/AST fix-ups/syntax highlighting with AST traversal/etc.)
  • Parse/interpret disturbingly large portions of makefiles.  Sure, it ignores the rules, and I’ve only implemented the functions I require, but it does all the conditional and include stuff with variable expansion, including some key functions like foreach/filter/etc.
  • Parse jar manifests sufficiently well to figure out what file ends up at what chrome path.
  • Cache its javascript parse results at both the AST and (sorta-semantic) processing level, among other things.  Hooray for cerealizer which dares persist/de-persist that which pickle dare not.  (Nested classes.)  (Note: We don’t cache XBL stuff yet, and the ASTs are large enough that de-persisting them can be quite perceptible.)

What is not crazy, but still nice:

  • The traces are now much more reliable thanks to modifications to the Mozilla USDT probes to provide sufficient information for us to distinguish between JavaScript execution contexts (namely, JSContext).  Modifications were also made to avoid the ‘guessing’/ghost value problems that happen when native functions were called.
  • A foolish bug in the sparkbar calculation has been fixed.  aka “Now With Accuracy”!
  • If a function in a trace called another function or was called by another function, this will be displayed inline in the source display.
  • Infer ‘native’ functions (with the above additional modifications to the Mozilla USDT probes), assigning them to an object.  This ends up being Object, ChromeWindow, or other native Class type.  Some of this may be mooted by getting the XPConnect probes reliably in the mix.

What doesn’t it do?

  • Add the XPConnect js_Invoke probes; I punted on that because that was turning out to be difficult to get right.
  • It ignores .xul files for now.  Although xul files primarily appears in a caller context (as told by function-info probes), they can also be a callee when someone pulls a fast one and inlines some simple code in a script tag.  We brutally mis-attribute the call to the previous function when this happens.  This will eventually get resolved because we will need to understand .xul files for namespace reasons.  Also, people sound like they’re interested in who overlays what and the like, and that’s sorta right up our alley thanks to all the overkill stuff we do.
  • Exhaustively determine reads from/contributions to the ‘global’ (window or what not) namespace/scope.  The groundwork is there in terms of understanding the contribution of top-level statements to the namespace or its reads from it, but we don’t traverse into functions.
  • Associate functions with an object/type (ignoring the native function case).  This requires more semantic understanding.
  • Clicking on functions still doesn’t do anything.  I disabled that before my first post on pecobro due to firefox-crashing issues, and still haven’t gotten around to resolving it.
  • A usable overview visualization.  The overview diagram has become cluttered by the presence of so many ‘relevant’ (touched) files.

pecobro: the performance code browser (early stage)

At the beginning of last week, I had gotten dtrace working on a Mac Mini using the Mozilla javascript-provider probes.  Very cool stuff, but it left me with several questions about what would really be best to do next:

  • How do I best understand what I’m seeing?  (Most of the codebase is brand new to me…)
  • How do I share the data with others in a way that is both comprehensible and allows them to draw their own conclusions from the data?
  • What can I do to reduce the effort required to work on performance problems?

I was tempted to just try and just dig into the system so I could have something to show immediately, but I knew it would still take a while to see the big picture just using an editor/ctags/lxr/opengrok, even informed by dtrace.  And even then, that big picture doesn’t scale well; whatever picture I managed to formulate would be stuck inside my head…

So my solution was to try and build a tool that could help me accomplish my short-term goals soon, and have the potential to grow into a usable solution to all of the above… eventually.  The goal, in a nutshell, is to provide a code browser for javascript that is able to integrate performance information (retrieved from traces) alongside the code.  Seeing that lxr/mxr and opengrok didn’t understand javascript or XBL all that well, it also seemed feasible to try and improve on their browsing capabilities for javascript.  A far-down-the-road goal is also to be able to pull in information from the underlying C++ code as well, potentially leveraging dehydra, etc.  (This would primarily be for understanding what happens when we leave the javascript layer, not trying to be the same solution for C++ space.)

So what can it do so far?  You can go try it for yourself if you like as long as you keep your expectations very low and realize the current state does not reflect all of the bullet points below.  Also, you probably want firefox 3.0.  Or you can read my bullet points:

  • Parse custom DTrace script output!  The Mozilla DTrace probe points could probably use a little love to improve what we are able to get out.  Also, I think it’s betraying us somewhere.
  • Parse JavaScript! Sorta!  (I hacked in support for the regular expression syntax, but I haven’t corrected the ambiguity with division, so things with division break.  Also, there’s at least one or two other glitches that cause early termination.) [Yay antlr!]
  • Parse XBL!  Even with entity inlining!  Even when people put #ifdefs in the XML document! Sorta!  We don’t actually do anything intelligent with the XBL right now or with its JavaScript, but it won’t take much to get that much improved. [Yay elementtree!]
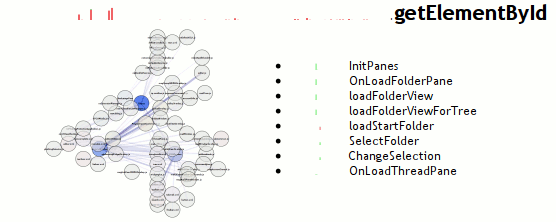
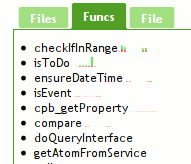
  • Visualize some stuff!  Inter-file relationship graph in the overview.  In the code and ‘Funcs’ sidebar tab you get a sparkbar where each bar represents a time interval.  The height of the par is the percentage of possible time we could have spent in that time interval.  Red means we belive that time was spent in the function itself, green means we think we spent that time in calls to other functions. [Yay visophyte!]
  • Navigate with history!  Click on the overview graph and you go to things.  Click on the file names in the ‘Files’ list and you go to the files.  I tried to make it so you could click on function names in the side bars to go to them, but jquery.scrollTo and/or firefox 3.0b5 had serious crashing issues.  [Yay jquery, jquery.history!]
  • See syntax-highlighted code with random headings intertwined (shows the parser worked) and potentially a visualization.  [Yay pygments!]

My hope in the near-term is to fix the outright bugs (parsing issues), get XBL going, and then augment the function information with more trace-derived data including more traditional call-stacks, etc.  Then the tool should be sufficiently usable that my immediate focus can change to creating automated tests to actually gather performance/execution traces so we can use the tool for what I started it for.  This may also get shelved for a while if it turns out that we need action (patches) immediately.

Mozilla JavaScript DTrace Probes, visichron style

 dtrace javascript snippet

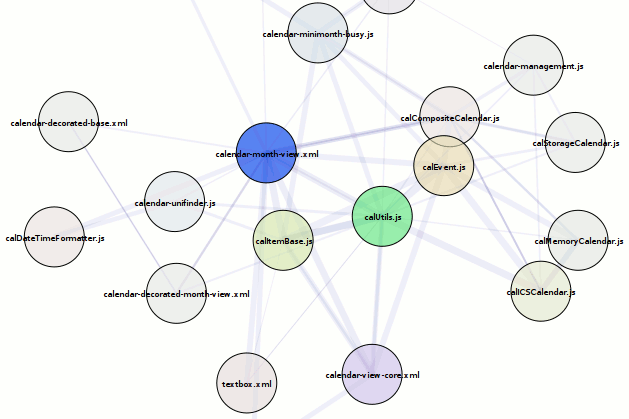
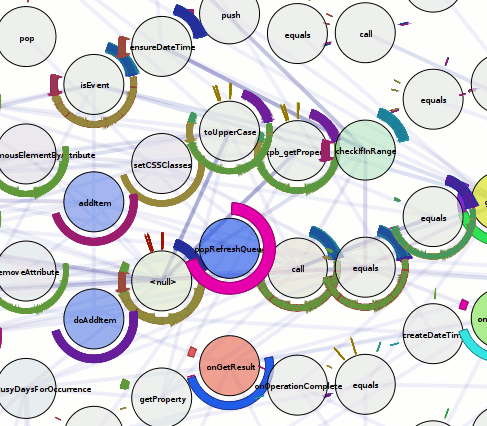
This visualization is the result of an adapted visichron.py script (from my chronicle-recorder ‘chroniquery’ bindings) run against the output of a custom DTrace script (using the Mozilla JS providers) on OS X.  It’s a proof-of-possibility rather than anything immediately useful.

The differences from the last visichron post (using chronicle-recorder as a back-end) are:

  • Node hues are distinct based on the file the javascript was executed from.  (Saturation still varies with amount of time spent in the function.)
  • Graph layout is done using graphviz’s neato’s “ipsep” (experimental) mode.  This works fantastically well at reducing/eliminating overlap.  Having said that, a hierarchical layout may make more sense.
  • Ring colors are based on call depth (so redundantly encoded with the ring radius) rather than any knowledge about the control-flow.  Full control-flow information is not readily available and would be extremely expensive, but we could provide at least some degree of approximation using the calls made by the function as indicators.  Of course, the ring visualization at this point and for this purpose is probably better represented as non-nested (side-by-side rings of different radii; not containing each other) faux-continuous ring slices with transparency varying by amount of time spent in the function at that call-depth.  This would simplify the object model, allowing for non-insane use of the SVG backend and interactivity enhancements.

scaled indexed