monitoring gaia travis build status using webmail LED notifiers

usb LED webmail notifiers showing build status

For Firefox OS the Gaia UI currently uses Travis CI to run a series of test jobs in parallel for each pull request.  While Travis has a neat ember.js-based live-updating web UI, I usually find myself either staring at my build watching it go nowhere or forgetting about it entirely.  The latter is usually what ends up happening since we have a finite number of builders available, we have tons of developers, each build takes 5 jobs, and some of those jobs can take up to 35 minutes to run when they finally get a turn to run.

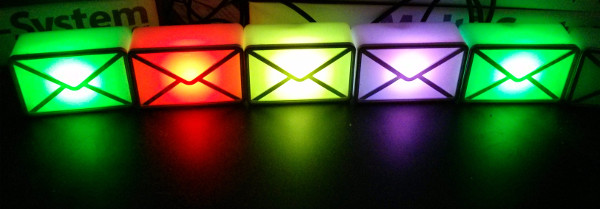
I recently noticed ThinkGeek had a bunch of Dream Cheeky USB LED notifiers on sale.  They’re each a USB-controlled tri-color LED in a plastic case that acts as a nice diffuser.  Linux’s “usbled” driver exposes separate red/green/blue files via sysfs that you can echo numbers into to control them.  While the driver and USB protocol inherently support a range of 0-255, it seems like 0-63 or 0-64 is all they give.  The color gamut isn’t amazing but is quite respectable and they are bright enough that they are useful in daylight.  I made a node.js library at https://github.com/asutherland/gaudy-leds that can do some basic tricks and is available on npm as “gaudy-leds”.  You can tell it to do things by doing “gaudy-leds set red green blue purple”, etc.  I added a bunch of commander sub-commands, so “gaudy-leds –help” should give a lot more details than the currently spartan readme.

I couldn’t find any existing tools/libraries to easily watch a Travis CI build and invoke commands like that (though I feel like they must exist) so I wrote https://github.com/asutherland/travis-build-watcher.  While the eventual goal is to not have to manually activate it at all, right now I can point it at a Travis build or a github pull request and it will poll appropriately so it ends up at the latest build and updates the state of the LEDs each time it polls.

Relevant notes / context:

  • There is a storied history of people hooking build/tree status up to LED lights and real traffic lights and stuff like that.  I think if you use Jenkins you’re particularly in luck.  This isn’t anything particularly new or novel, but the webmail notifiers are a great off-the-shelf solution.  The last time I did something like this I used a phidgets LED64 in a rice paper lamp and the soldering was much more annoying than dealing with a mess of USB cables.  Also, it could really only display one status at a time.
  • There are obviously USB port scalability issues, but you can get a 24-port USB hub for ~$40 from Amazon/monoprice/etc.  (They all seem to be made by the same manufacturer.)  I coincidentally bought 24 of the notifiers after my initial success with 6, so I am really prepared for an explosion in test jobs!
  • While I’m currently trying to keep things UNIXy with a bunch of small command-line tools operating together, I think I would like to have some kind of simple message-bus mechanism so that:
    • mozilla-central mach builds can report status as they go
    • webhooks / other async mechanisms can be used to improve efficiency and require less manual triggering/interaction on my end.  So if I re-spin a build from the web UI I won’t need to re-trigger the script locally and such.  Please let me know if you’re aware of existing solutions in this space, I didn’t find much and am planning to just use redis as glue for a bunch of small/independent pieces plus a more daemonish node process for polling / interacting with the web/AMQP.
  • There are efforts underway to overhaul the continuous integration mechanism used for Gaia.  This should address delays in starting tests by being able to throw more resources at them as well as allow notification by whatever Mozilla Pulse’s successor is.

unified JS/C++ backtraces, colorized backtraces, colorized source listing for gdb 7.3/archer-trunk updated

type "mbt", see this.

gdb has had integrated python support for some time and it is truly awesome.  The innards have changed here and there, so my previous efforts to show colorized/fancy backtraces, show colorized source listings, and provide unified JS/C++ mozilla backtraces (with colors still) have experienced some bit-rot over time.

type "cbt", see this

I have de-bitrotted the changes, hard.  Hard in this case means that the changes depend on gdb 7.3 which only exists in the future or in the archer repo you can find on this wiki page, or maybe in gdb upstream but I already had the archer repo checked out…

type "sl", see this.

In any event, if you like gdb and work with mozilla, you will not only want these things, but also Jim Blandy’s mozilla-archer repo which has magic SpiderMonkey JS helpers (one of which mozbt depends on; those JSStrings are crazy, yo!).  Coincidentally, he also depends on the future, and his README tells you how to check out the archer branch in greater detail.

You can get your own copy of these very exciting gdb python things from my github pythongdb-gaudy repo.

The important notes for the unified backtrace are:

  • It does’t work with the tracing JIT; the trace JIT doesn’t produce the required frames during its normal operation.
  • It might work with the method JIT if gdb could unwind method JIT frames, but it doesn’t seem to do that yet.  (Or I didn’t build with the right flag to tell it to use a frame pointer/etc., or I am using the wrong gdb branch/etc.)  Once the Method JIT starts telling gdb about its generated code with debug symbols and the performance issues in gdb’s JIT interface are dealt with, you can just use the colorizing backtrace because no special logic is required to interleave frames at that point and Jim Blandy’s magic JS pretty printers should ‘just work’.
  • Don’t forget that if you just want a pure JS backtrace (and with all kinds of fanciness) and have a debug build, you can just do “call DumpJSStack()” in gdb and it will call back into XPConnect and invoke the C++ code that authoritatively knows how to walk this stuff.
  • If you’re cool and using generators, then you’re stuck with the interpreter, so it will totally work.

prototype unified JavaScript/C++ back-traces for Mozilla in (archer) gdb

fused-js-cpp-backtrace-2-upper-half

As far as I know (and ignoring my previous efforts on chroniquery along these lines), up until now you had your C/C++ Mozilla backtraces via gdb (chocolate) and your JS backtraces via “call DumpJSStack()” or the debugger keyword from within JS (peanut butter), but these two great flavors had never come together to make a lot of money for dentists.

The screenshots (which is actually just one screenshot split in two) show invocation of a custom python gdb command building on my previous exciting pretty gdb commands.  The command has filtered out boring JS interpreter / XPConnect code and interleaved exciting interesting JS stack frames.

The implementation is reasonably simple and intended to be able to be implemented using VProbes to support my recent performance work along those lines.  We walk stack frames the usual way.  Ahead of time, we have marked out the PC ranges of interesting JS interpreter functions (js_Interpret and js_Execute).  If the stack frame’s instruction pointer is in one of those functions we grab the JSContext argument.  We pop frames until we reach the native frame those functions allocate from their own stack space (whose boundaries we know from the stack walking).

There is one trick we have to do involving dormantFrameChain.  While js_Execute has a consistent and straightforward usage of JS_SaveFrameChain, XPConnect and its quickstub friends are more complex.  Right now we use a dumb heuristic that just looks if our frame pointer is 0 and there is a dormantFrameChain, and in that case we restore it.  (Thankfully the garbage collector needs to know about the shelved frames, otherwise we might have to chase frames down.)  I haven’t put much effort into thinking about it, but the heurstic seems a bit reckless.  We could likely just concurrently walk the XPConnect context stack to figure out when to restore dormant frame chains.  The existing VProbe JS stack (only) code already goes to the horrible effort to get at the thread-local stack, so it wouldn’t be too much more work.  Things probably also fall down during garbage collection right now.

Hg repository is here.  Under no circumstances try to use this with jblandy’s excellent archer-mozilla JS magic right now.  The current code is very distrustful of gdb.Value in a dumb way and does exceedingly dangerous things wherein pointers are bounced to strings and back to integers because direct integer coercion is forbidden.  With pretty printers installed this is likely to break.  Also, this is all only tested on 1.9.1.

fused-js-cpp-backtrace-2-lower-half

Better error reporting for the mozilla platform

old-and-busted-error-reporting

If you develop for the mozilla platform, you might be used to error messages like the above.  (Or you might wish you got error messages like the above…)  An uncaught javascript exception has resulted in a message in the error console as well as some equivalent stdout spew because it’s a debug build.  While any error is better than no error, it doesn’t exactly narrow down how we got there.

Wouldn’t it be nice if we got back-traces for these errors?

new-error-reporting-hotness

The future is now, people!  And it comes in the convenient form of a patch against the 1.9.1 branch, just like you always dreamed!  Also, an extension.

Currently (pre-patch), there are basically 3 ways scripting errors can show up in the platform:

  1. nsIScriptError instances.  These are what show up on the error console.  These have information equivalent to a single stack frame.
  2. nsIException instances.  These can provide a stack in the form of an nsIStackFrame chain (the same thing Components.stack gives you).  These get converted into nsIScriptError instances when it comes time to report them to the error console.  From a stack perspective, only XPConnect produces nsIException instances with stack traces, although you can make your own via Components.Exception.  A fundamental limitation of these stack traces is that they are only constructed from live JS call stacks, so if a JS exception has unwrapped its way to the top-level you are out of luck.
  3. JavaScript Error instances.  These have a private super-rich (it even knows arguments!) call-stack that can only be exposed as a string via the non-standard stack attribute.  XPConnect understands JS error reports (the ‘flat’ mechanism by which SpiderMonkey reports errors/exceptions to C++ code), but it has no clue about exceptions and their Error form of existence.  The exceptions in their error report guise are converted into nsIScriptError instances.

What the patch (on bug 493414) does is:

  • Introduce an nsIScriptErrorEx interface that extends nsIScriptError to provide a ‘location’ attribute like nsIException which is an nsIStackFrame.
  • Modify nsScriptError to implement the extended nsIScriptErrorEx.  Alternatively, I could have made XPConnect’s nsXPCException class implement nsIScriptError or nsScriptError also implement nsIException or something like that and not introduced nsIScriptErrorEx at all.
  • Modify all nsIScriptError-creation sites that I care about (I’m not looking at you, DOM workers) to try and provide or propagate existing nsIStackFrame information.
  • If a JS stack frame is not available, but an exception is in the form of a JS error, suck the call stack out of it.  Theoretically, this should not be a fallback but rather the default case, but it depends on some JS/XPConnect implementation details I am trying to avoid finding out about for now.
  • Modify the JS API to provide call stack sucking functionality.
  • Does various sketchy things to expose XPCJSStack::CreateStack from XPConnect to the error reporters in other modules.  If you thought the choice of creating nsIScriptErrorEx was sketchy, welcome to the Downtown East Side of dubious patches.  I expect there is no chance of it working on Windows because of this, and you may be out of luck on OS X.  Behold your comeuppance, popular platforms!

What the extension (repo) does is:

  • Add an nsIConsoleListener at app-startup that is aware of nsIScriptErrorEx and knows how to generate totally wicked 256-color ANSI escape sequences.
  • Not expose the stack traces in the error console.  The error console is for suckers who don’t have impossibly fast reflexes and a love of XON/XOFF flow control.
  • Only target Thunderbird.  Behold your comeuppance, all other mozilla applications!  (The extension wizard didn’t know how to do the thing that makes it work on all xulrunner-based things…  feel free to push a fixed install.rdf to my repo.)

I have logged bug 493414 to hold the patch and hopefully track the effort moving forward.

gaudily syntax-highlighted code listings in (archer) gdb

pyglist sl command output

Gaudily syntax-highlighted code listing in gdb joins the gaudy gdb plugin family!  (Other members include gaudily colorized backtraces, which you can also see in the bottom of the screenshot.)  This, of course, requires gdb with python crammed inside.  It might require one crammed a few months ago too; I haven’t updated my archer-gdb repo for at least that long.

The “sl” plugin uses Pygments for the syntax highlighting.  Although pygments has a 256 color terminal formatter (woo!), I ended up using my pyflam module because it did not support my need to color the background of the current line without doing something convoluted.  (I would have had to create a filter that did its own line-counting and created background-color-styled token variant of every token on the desired line.)  Also, it didn’t do line numbers.

The color theme is based off the “fruity” color theme.  Much of the gaudy comes from a filter I added that tries to do various Mozilla C++-aware code styling things by recognizing naming patterns of Name tokens.  Before you complain about the colors hurting your brain, remember that this is the alternative:

not-pyglist, standard list command

That’s right.  It’s like looking at static.  You can barely make anything out.  And imagine if it was more than just the 10 lines “list” gives you.

Anywho, the repo is here: http://hg.mozilla.org/users/bugmail_asutherland.org/pythongdb-gaudy/

The README tells you what to do.  For complete-ness, and because I went to all the effort to write documentation for the command, here is what it does!

Prints a syntax-highlighted source listing.  Currently limited to only
work based on the current debug frame and position.

By default, the 11 lines before the current position and 8 lines after are
displayed.  A line context is saved between command invocations if the current
source line does not change.

Arguments when used in a new context:
  (none)  Shows the 11 lines before the current position and 8 lines after.
  N       Shows the N/2 lines befores the current position and N/2 lines after.
  -N      Shows the N lines before the current position and 8 lines after.
  +N      Shows the 11 lines before the current position and N lines after.
  M N     Shows the M lines before the current position and N lines after.

Arguments in an existing context:
  (none)  Shows the 20 lines after the last-shown lines.
  -       Shows the 20 lines preceding the last-shown lines.
  N       Shows the N lines after the last-shown lines.
  -N      Shows the N lines preceding the last-shown lines.
  M N     Shows the M last lines of the last-shown lines and N lines after the
            last-shown lines.

Arguments regardless of context
  @A,B    Shows lines A through B.