more (clicky!) mailing-list visualization a la visotank, couchdb

visotank-shot-1.png

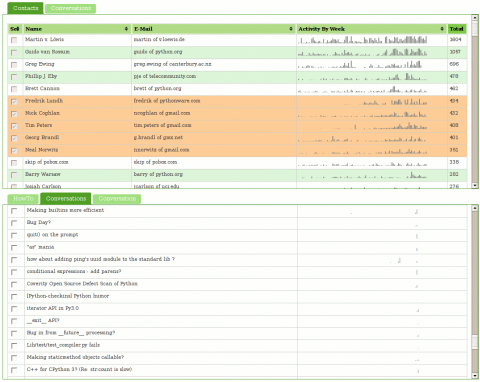
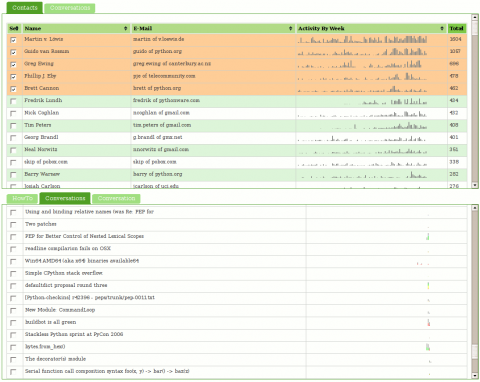
Visotank now allows you to select some authors of interest from a sortable list of contacts, and then show the conversations they were involved in. You get the previously shown sparkbars for the author’s activity. You also get sparkbars showing the conversation activity, with each author assigned a color and consistent stacking position in that sparkbar. Click on the screenshots for zoomed versions of the screenshots to see what I mean.

You can click on things yourself at http://clicky.visophyte.org:8080/. Please only go there if you’re okay with restarting your Firefox session (especially true if Firebug is on.) All tables/images are the real thing and not fetched on demand… which results in Firefox having to pull down a lot of images. Click on some rows in the contacts table to select them. Then, in the lower tab group, click on the “conversations” tab. This will then fetch all the conversations those selected users were involved in. The system will truncate more than 10 users, so don’t go crazy. The tabs are re-fetched on switch, so if you change your contact selections, in the lower tab group, click away to “HowTo”, then back to “Conversations”. The “Conversation” tab does nothing and is a big lie.  Great UI, I know.

visotank-shot-2.png

I think you will find that sparkbar visualizations of the conversation traffic with a weekly granularity are rather useless. I think a reasonable solution would be a ‘zoomed’ sparkbar with an indication of the actual uniform timeline scale included. Since the images currently show about 2 years of data, a thread that happened 1 year ago would be centered in the middle of the image, but with its actual horizontal scale being inconsistent with that position. Future work, as always.

I have used Pylon’s Beaker caching layer to attempt to make things reasonably responsive. While CouchDB view updates are sadly quite lengthy (many many minutes when dealing with 16k messages; python-dev from Jan 2006 through Nov 2007), that is thankfully a one-off sort of thing. (The data-set is immutable once imported and I don’t change schemas that often.) The main performance hit is that I can only issue one range of keys to query in a request, so if I am trying to snipe a subset of non-consecutive information, I have to issue multiple requests. (I don’t believe POSTed views can operate against views in the database…)

Regrettably, I think my conclusion about CouchDB is that it (or something like it) will be truly fantastic in the future, but it is not going to get there soon enough for anything that hopes to be ‘productized’ anytime soon. The next thing I want to look at is using a triple-store to model some of the email data schema; my efforts from the visterity hacking suggest it could be quite useful. Of course, even if triple stores work out, I suspect a more traditional SQL database will still be required for some things. Combined with a thin custom aggregation and caching layer, that could work out well.

Note: I should emphasize that my CouchDB schema could be more optimized, but part of the experiment is/was to see if the views saved me from having to jump through clever hoops.

first steps to interactive fun using CouchDB

visotank-first-python-dev-sparkbars1.png

First, let me say that Pylons with its Paste magic is delightful; lots of nice round edges helped me get something simple up and running in no time, and using genshi to boot.

The new tool, visotank, is ingesting the python-dev mailman archives (as previously visualized) and putting them into CouchDB. The near-term goal is to allow for interactive exploration/visualization of the archives. The current result, as pictured, is simply sparkline barcharts of people’s posting history. Left-to-right, present-to-past, weekly, one (vertical) pixel per message, truncating at the image height (12 pixels).

Although the input processing thus far is specific to mailing list archives, the couchdb schema in use is for generic e-mail traffic. The messages are even coerced into rfc2822 format for ‘raw’ storage.

The ability to use ‘map’ multiple times in couchdb views to spread information is delightful. What I really would like is more reduce functionality or, more specifically, just accumulate. The sparkbars get their data from statistics with keys [contact id, timestamp of time period] and value 1, one per message. I would love for couchdb to provide a way to aggregate all those values with identical keys into a single row with the sum as the value. I’ll look into this and the view implementation before writing any more on the subject, but if someone out there already knows a way to do this, please let me know.

visotank-first-python-dev-sparkbars2.png

python-dev mailman archive thread-arc visualizations

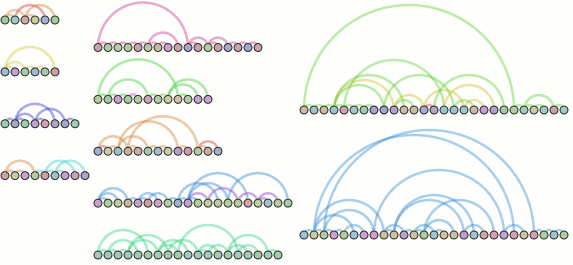
What’s new? Mailman archive processing! Bezier segmenting for more accurate arcs (thank you Luc Masonobe)! Pseudo-thread-arcs! (Actual thread arcs as visible on the whoa-awesome-but-why-aren’t-you-released-software ReMail project would seem to more practically squash ridiculously-large arcs and of course leverage the other side.)

python-dev-july-2007-threadarc-assembled.png

  • Node colors are per-author. The middle bottom thread demonstrates the need for a smarter distinct color logic, as I’m pretty confident that thread isn’t the result of one person with multiple personalities.
  • Nodes are sequenced time-wise from left-to-right with uniform (pixel-based) spacing. I tried placing them by time, but things clump up pretty uselessly. Non-linear time scaling is on my list.
  • Arc colors are based on the subject, whereas reconstruction is based on the headers. As such, arc colors in a thread may change if someone changes the subject.
  • Arc width is constant, though I was entertaining varying it based on the amount of new content in each e-mail. Of course, there’s always knobs to tweak.

Please note that the above image is actually the result of re-arranging the contents of two separate images; the layout currently used just stacks them all vertically with a (dynamic) uniform spacing. For this reason, the rightmost threads are actually from a separate run where I set the ‘chaos’ filter with a much higher bar. Oh, and those are threads from the July 2007 python-dev archive, although without labeling you have no reason to believe me.

python-dev-2007-threadarc-chaos200.png

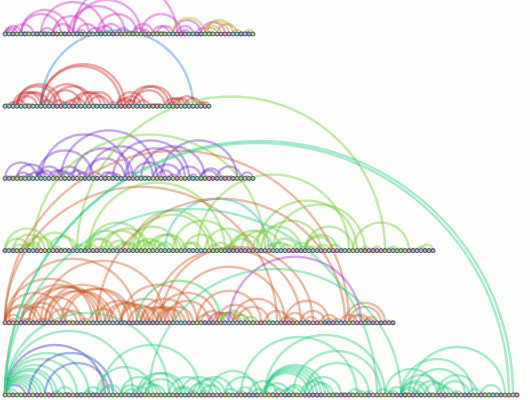
And this is the result of sucking up January-July 2007, filtering on threads with a ‘chaos’ greater than 200. (‘chaos’ being an arbitrary and arguably incorrect term for the total distance of all nodes from their parent (less one). So a thread where every message is just a response to the one that chronologically preceded it will have a chaos of 0. A thread where every message is a response to the message before the one that chronologically preceded it will have a chaos of (n – 2) where n is the number of messages. Apply algebra, rinse, and repeat.

I’m going to try and get this going with Thunderbird reasonably soon, but it might take longer than I’d hope. Thunderbird w/pyxpcom didn’t build clean on my amd64-arch laptop, chronicle-recorder’s valgrind crashes on amd64, and the like means some busywork on the horizon.