performance annotated SQLite EXPLAINation visualizations using systemtap

For the Thunderbird 3.1 release cycle we are not just fixing UX problems but also resolving various performance issues.  Building on my previous work on a visualization of SQLite opcode control flow graphs using graphviz I give you… the same thing!  But updated to more recent versions of SQLite and integrating performance information retrieved through the use of systemtap with utrace.

In this case we are using systemtap to extract the number of times each opcode is executed and the number of btree pages that are requested during the course of executing the opcode.  (We do not differentiate between cache hits and misses because we are looking at big-O right now.)  Because virtual tables (like those used by FTS3) result in nested SQLite queries and we do not care about analyzing the queries used by FTS3, we ignore nested calls and attribute all btree page accesses to the top-level opcode under execution.

Because the utility of a tool is just as dependent on ease of use as its feature set, I’ve cleaned things up and made it much easier to get information out of Thunderbird/gloda with this patch which should land soon and provides the following:

  • The gloda datastore will write a JSON file with the EXPLAINed results of all its SQL queries to the path found in the preference mailnews.database.global.datastore.explainToPath.  This preference is observed so that setting it during runtime will cause it to create the file and begin explaining all subequently created queries.  Clearing/changing the preference closes out the current file and potentially opens a new one.
  • Gloda unit tests will automatically set the preference to the value of the environment variable GLODA_DATASTORE_EXPLAIN_TO_PATH if set.
  • A schema dump is no longer required for meta-data because we just assume that you are using a SQLite DEBUG build that tells us everything we want to know about in the ‘comment’ column.
  • grokexplain.py now uses optparse and has more internal documentation and such.

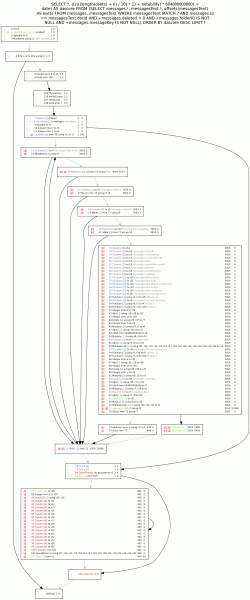
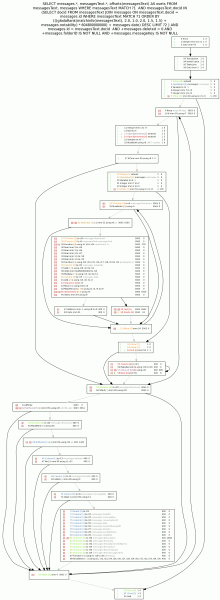
So what do the pretty pictures show?

  • Before: A gloda fulltext query search retrieves all of the results data before applying the LIMIT.  This results in a lot more data transplanted into temporary results tables than we will end up using; wasted bookkeeping.  Additionally, we incur the row lookup costs for both our messages data storage table and our fulltext messagesText table for all hits, even the ones we will not return.  (Noting that there was no escaping hitting both tables since we were using offsets() and it hits the fulltext table as part of its operation.)
  • After: We perform an initial query phase where we minimize wasted bookkeeping by only retrieving and using the bare minimum required to compute the LIMITed list of document id’s.  Additionally, by use of the FTS3 matchinfo() function instead of the offsets() function we are able to avoid performing row lookup on the messagesText table for results that will not be returned to the user.  Use of the matchinfo() function requires a custom ranking function which allows us to be somewhat more clever about boosting results based on fulltext matches too.
  • The poor man’s bar graphs in the pictures are expressing a hand-rolled logarithmic scale for the number of invocations (left bar) and number of btree pages accessed (right bar).  On the right side of each line the actual numbers are also presented in the same order.  The goal is not to convey good/bad so much as to draw the eye to hot spots.

Notes for people who want more to read:

  • SQLite has built-in infrastructure to track the number of times an opcode is executed as well as the wall-clock time used; you do not have to use systemtap.  It’s a conditional compilation kind of thing, just -DVDBE_PROFILE and every statement you execute gets its performance data appended to vdbe_profile.out when you reset the statement.  It doesn’t do the btree pages consulted trick, but it’s obviously within its power with some code changes.
  • Our use of systemtap is primarily a question of discretionary reporting control, the ability to integrate the analysis across other abstraction layers, and various build concerns.  The JSON output is not a driving concern, just something nice we are able to do for ourselves since we are formatting the output.
  • The tool has really crossed over into the super-win-payoff category with this fix investigation.  (Having said that, I probably could have skipped some of the data-flow stuff last time around.  But these projects are both for personal interest and amusement as well as practical benefit, so what are you gonna do?  Also, that effort could pay off a bit more by propagating comments along register uses so that the LIMIT counter register r8 and the compute-once r7 in the after diagram would not require human thought.)

References:

  • The grokexplain repo.  Used like so: python grokexplain.py –vdbe-stats=/tmp/glodaNewSearchPerf.json /tmp/glodaNewSearchExplained.json -o /tmp/glodasearch-newcheck
  • The systemtap script in its repo.  Used like so: sudo stap -DMAXSTRINGLEN=1024 sqlite-perf.stp /path/to/thunderbird-objdir/mozilla/dist/lib/libsqlite3.so > /tmp/glodaNewSearchPerf.json
  • The bug with the gloda explain logic patch and the improved SQL query logic.  I also used the tooling to fix another (now-fixed) bug, but that problem turned out to be less interesting.

Using VMWare Record/Replay and VProbes for low time-distortion performance profiling

profile-performance-graph-enumerateProps

The greatest problem with performance profiling is getting as much information as possible while affecting the results as little as possible.  For my work on pecobro I used mozilla’s JavaScript DTrace probes.  Because the probes are limited to notifications of all function invocations/returns with no discretion and there is no support for JS backtraces, the impact on performance was heavy.  Although I have never seriously entertained using chronicle-recorder (via chroniquery) for performance investigations, it is a phenomenal tool and it would be fantastic if it were usable for this purpose.

VMware introduced with Workstation 6/6.5 the ability to efficiently record VM execution by recording the non-deterministic parts of VM execution.  When you hit the record button it takes a snapshot and then does its thing.  For a 2 minute execution trace where Thunderbird is started up and gloda starts indexing and adaptively targets for 80% cpu usage, I have a 1G memory snapshot (the amount of memory allocated to the VM), a 57M vmlog file, and a 28M vmsn file.  There is also and a 40M disk delta file (against the disk snapshot), but I presume that’s a side effect of the execution rather than a component of it.

The record/replay functionality is the key to being able to analyze performance while minimizing the distortion of the data-gathering mechanisms.  There are apparently a lot of other solutions in the pipeline, many of them open source.  VMware peeps apparently also created a record/replay-ish mechanism for valgrind, valgrind-rr, which roc has thought about leveraging for chronicle-recorder.  I have also heard of Xen solutions to the problem, but am not currently aware of any usable solutions today.  And of course, there are many precursors to VMware’s work, but this blog post is not a literature survey.

There are 3 ways to get data out of a VM under replay, only 2 of which are usable for my purposes.

  1. Use gdb/the gdb remote target protocol.  The VMware server opens up a port that you can attach to.  The server has some built-in support to understand linux processes if you spoon feed it some critical offsets.  Once you do that, “info threads” lists every process in the image as a thread which you can attach to.  If you do the dance right, gdb provides perfect back-traces and you can set breakpoints and generally do your thing.  You can even rewind execution if you want, but since that means restoring state at the last checkpoint and running execution forward until it reaches the right spot, it’s not cheap.  In contrast, chronicle-recorder can run (process) time backwards, albeit at a steep initial cost.
  2. Use VProbes.  Using a common analogy, dtrace is like a domesticated assassin black bear that comes from the factory understanding English and knowing how to get you a beer from the fridge as well as off your enemies.  VProbes, in contrast, is a grizzly bear that speaks no English.  Assuming you can convince it to go after your enemies, it will completely demolish them.  And you can probably teach it to get you a beer too, it just takes a lot more effort.
  3. Use VAssert.  Just like asserts only happen in debug builds, VAsserts only happen during replay (but not during recording).  Except for the requirement that you think ahead to VAssert-enable your code, it’s awesome because, like static dtrace probes, you can use your code that already understands your code rather than trying to wail on things from outside using gdb or the like.  This one was not an option because it is Windows only as of WS 6.5.  (And Windows was not an option because building mozilla in a VM is ever so slow, and, let’s face it, I’m a linux kind of guy.  At least until someone buys me a solid gold house and a rocket car.)

profile-performance-graph-callbackDriver-doubleClicked

My first step in this direction has been using a combination of #1 and #2 to get javascript backtraces using a timer-interval probe.  The probe roughly does the following:

  • Get a pointer to the current linux kernel task_struct:
    • Assume we are uniprocessor and retrieve the value of x86_hw_tss.sp0 from the TSS struct for the first processor.
    • Now that we know the per-task kernel stack pointer, we can find a pointer to the task_struct at the base of the page.
  • Check if the name of our task is “thunderbird-bin” and bail if it is not.
  • Pull the current timestamp from the linux kernel maintained xtime.  Ideally we could use VProbe’s getsystemtime function, but it doesn’t seem to work and/or is not well defined.  Our goal is to have a reliable indicator of what the real time is at this stage in the execution, because with a rapidly polling probe our execution will obviously be slower than realtime.  xtime is pretty good for this, but ticks at 10ms out of box (Ubuntu 9.04 i386 VM-targeted build), which is a rather limited granularity.  Presumably we can increase its tick rate, but not without some additional (though probably acceptable) time distortion.
  • Perform a JS stack dump:
    • Get XPConnect’s context for the thread.
      • Using information from gdb on where XPCPerThreadData::gTLSIndex is, load the tls slot.  (We could also just directly retrieve the tls slot from gdb.)
      • Get the NSPR thread private data for that TLS slot.
        • Using information from gdb on where pt_book is located, get the pthread_key for NSPR’s per-thread data.
        • Using the current task_struct from earlier, get the value of the GS segment register by looking into tls0_base and un-scrambling it from its hardware-specific configuration.
        • Use the pthread_key and GS to traverse the pthread structure and then the NSPR structure…
      • Find the last XPCJSContextInfo in the nsTArray in the XPCJSContextStack.
    • Pull the JSContext out, then get its JSStackFrame.
    • Recursively walk the frames (no iteration), manually/recursively (ugh) “converting” the 16-bit characters into 8-bit strings through violent truncation and dubious use of sprintf.

The obvious-ish limitation is that by relying on XPConnect’s understanding of the JS stack, we miss out on the most specific pure interpreter stack frames at any given time.  This is mitigated by the fact that XPConnect is like air to the Thunderbird code-base and that we still have the functions higher up the call stack.  This can also presumably be addressed by detecting when we are in the interpreter code and poking around.  It’s been a while since I’ve been in that part of SpiderMonkey’s guts… there may be complications with fast natives that could require clever stack work.

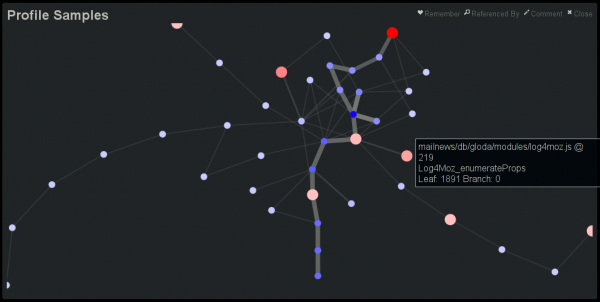
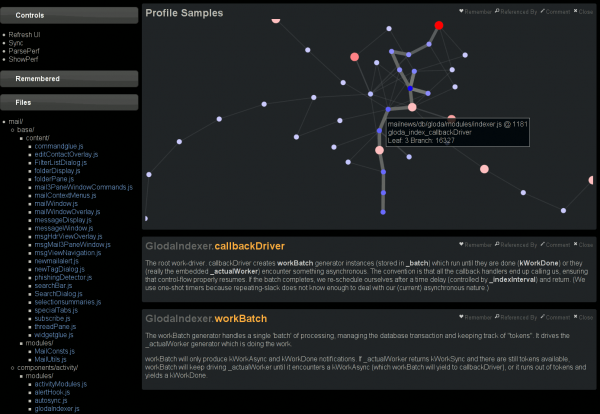
This blog post is getting rather long, so let’s just tie this off and say that I have extended doccelerator to be able to parse the trace files, spitting the output into its own CouchDB database.  Then doccelerator is able to expose that data via Kyle Scholz‘s JSViz in an interactive force-directed graph that is related back to the documentation data.  The second screenshot demonstrates that double-clicking on the (blue) node that is the source of the tooltip brings up our documentation on GlodaIndexer.callbackDriver.  doccelerator hg repovprobe emmett script in hg repo.

See a live demo here.  It will eat your cpu although it will eventually back off once it feels that layout has converged.  You should be able to drag nodes around.  You should also be able to double-click on nodes and have the documentation for that function be shown *if it is available*.  We have no mapping for native frames or XBL stuff at this time.  Depending on what other browsers do when they see JS 1.8 code, it may not work in non-Firefox browsers.  (If they ignore the 1.8 file, all should be well.)  I will ideally fix that soon by adding an explicit extension mechanism.