The title isn’t true yet, but it’s disturbingly almost-true. Pecobro’s hackish underpinnings have been “accidentally” replaced with surprisingly forward-looking code capable of supporting a much fancier feature set. (I didn’t mean to, but I got tricked because the incremental cost to doing the ‘right thing’ was always so low.)
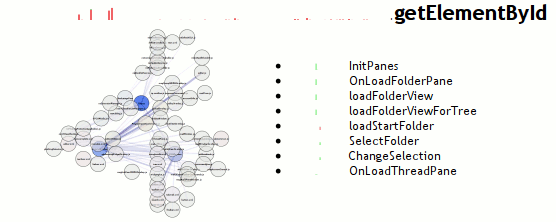
The trace that you can see here, by clicking on any of this text what has coloring (and using firefox 3 in a session that you don’t mind if it crashes), is of running Mark Banner (Standard8)‘s Thunderbird bloatTest on OS X with DTrace probes enabled, but without actually doing the bloat testing. So Thunderbird starts up, opens the address book, closes it, opens the compose window, closes it, and then quits.
Here is a preliminary processed trace from a run triggering bug 296453. Be forewarned that there is some missing information from the underlying trace and so it’s not all that it could be. I think the XPConnect probes need to be fleshed out slightly more (and processed).
The code (both pecobro and mozilla codebase patches) is at: http://hg.mozilla.org/users/bugmail_asutherland.org/

What crazy overkill things can pecobro do now?
- Parse all of the javascript code used in Thunderbird, including nearly all (maybe all?) of the 1.x enhancements. The parser is still a bit hackish, especially when it comes to support of regexes, but it actually parses things. Thanks to Chris Lambrou for posting his initial JavaScript.g antlr3 grammar (and BSD licensing it) that I used as a basis for my hacky version. This was certainly a learning experience; I now know that javascript can never replace python in my heart…
- Find all of the places functions can be defines in javascript code and do a pretty good job at figuring out reasonable names for them. This even includes “(new)? Function()”. This allows us to use the function-info DTrace probes to use line number information to identify functions. We do this so that we can identify anonymous functions.
- Handle XBL as well as we handle pure-javascript files. (Parsing/AST fix-ups/syntax highlighting with AST traversal/etc.)
- Parse/interpret disturbingly large portions of makefiles. Sure, it ignores the rules, and I’ve only implemented the functions I require, but it does all the conditional and include stuff with variable expansion, including some key functions like foreach/filter/etc.
- Parse jar manifests sufficiently well to figure out what file ends up at what chrome path.
- Cache its javascript parse results at both the AST and (sorta-semantic) processing level, among other things. Hooray for cerealizer which dares persist/de-persist that which pickle dare not. (Nested classes.) (Note: We don’t cache XBL stuff yet, and the ASTs are large enough that de-persisting them can be quite perceptible.)

What is not crazy, but still nice:
- The traces are now much more reliable thanks to modifications to the Mozilla USDT probes to provide sufficient information for us to distinguish between JavaScript execution contexts (namely, JSContext). Modifications were also made to avoid the ‘guessing’/ghost value problems that happen when native functions were called.
- A foolish bug in the sparkbar calculation has been fixed. aka “Now With Accuracy”!
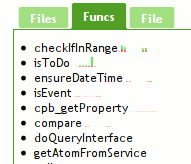
- If a function in a trace called another function or was called by another function, this will be displayed inline in the source display.
- Infer ‘native’ functions (with the above additional modifications to the Mozilla USDT probes), assigning them to an object. This ends up being Object, ChromeWindow, or other native Class type. Some of this may be mooted by getting the XPConnect probes reliably in the mix.
What doesn’t it do?
- Add the XPConnect js_Invoke probes; I punted on that because that was turning out to be difficult to get right.
- It ignores .xul files for now. Although xul files primarily appears in a caller context (as told by function-info probes), they can also be a callee when someone pulls a fast one and inlines some simple code in a script tag. We brutally mis-attribute the call to the previous function when this happens. This will eventually get resolved because we will need to understand .xul files for namespace reasons. Also, people sound like they’re interested in who overlays what and the like, and that’s sorta right up our alley thanks to all the overkill stuff we do.
- Exhaustively determine reads from/contributions to the ‘global’ (window or what not) namespace/scope. The groundwork is there in terms of understanding the contribution of top-level statements to the namespace or its reads from it, but we don’t traverse into functions.
- Associate functions with an object/type (ignoring the native function case). This requires more semantic understanding.
- Clicking on functions still doesn’t do anything. I disabled that before my first post on pecobro due to firefox-crashing issues, and still haven’t gotten around to resolving it.
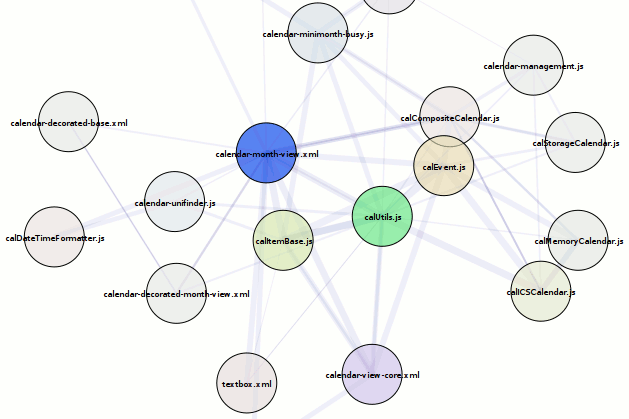
- A usable overview visualization. The overview diagram has become cluttered by the presence of so many ‘relevant’ (touched) files.


